On this page
The ocean does not simply get darker as you go down. Its temperature, salinity, density, oxygen, and biological conditions change with depth, often in distinct layers. In much of the open ocean, the largest short-term temperature changes occur near the surface, a strong transition appears below, and deeper water changes more slowly.
Latitude, season, currents, rainfall, ice, and the history of a water mass can all change the profile. The best way to understand the pattern is to look at a vertical profile: a line showing one property from the surface downward.
A Journey From the Surface to 2,000 Meters
From the surface downward, the upper layer, main transition, and deeper water respond to different processes and time scales.
The upper ocean changes quickly
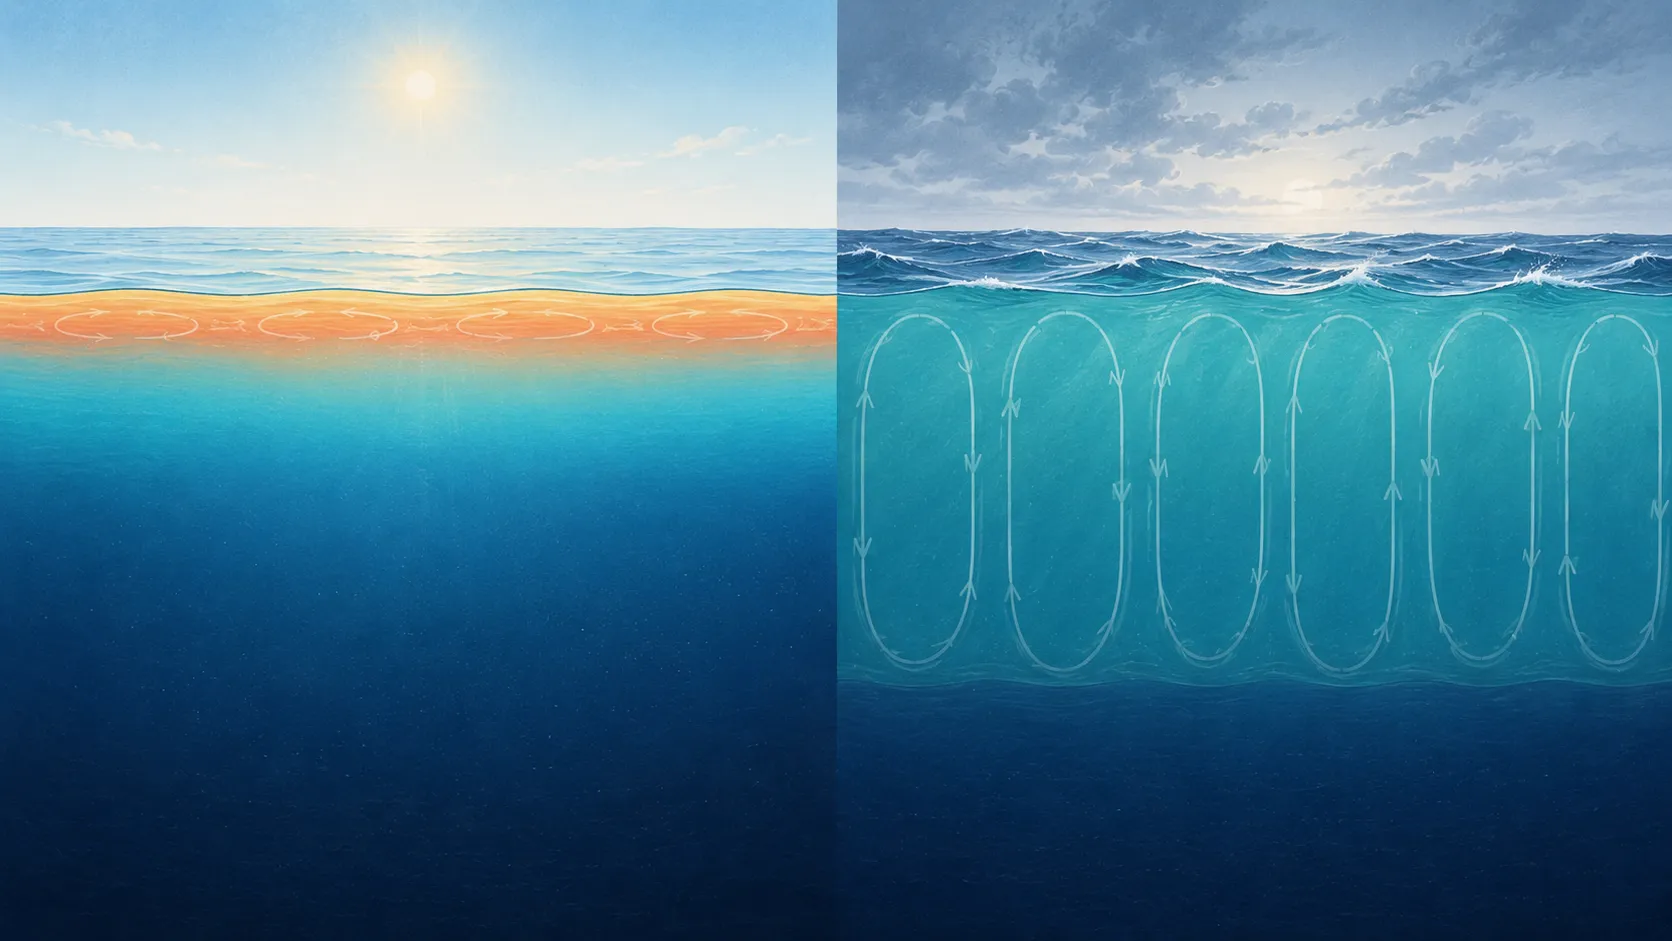
Sunlight heats the ocean from above. Wind, waves, cooling, evaporation, and rainfall also act first on the surface. As a result, the upper ocean responds strongly to the weather and seasons.
The top layer may be:
- Warm and strongly separated from the water below
- Nearly uniform because wind and cooling have mixed it
- Fresher after heavy rain or ice melt
- Saltier where evaporation exceeds precipitation
A sea-surface temperature map shows the surface conditions, while a vertical profile shows how far those conditions extend downward.
How Do Typhoons Change the Ocean? shows how to compare upper-ocean profiles before and after a storm.
For unusually warm conditions that persist, Marine Heatwaves Below the Surface explains how the depth and duration of warming relate to a seasonal baseline.
A transition appears below the surface layer
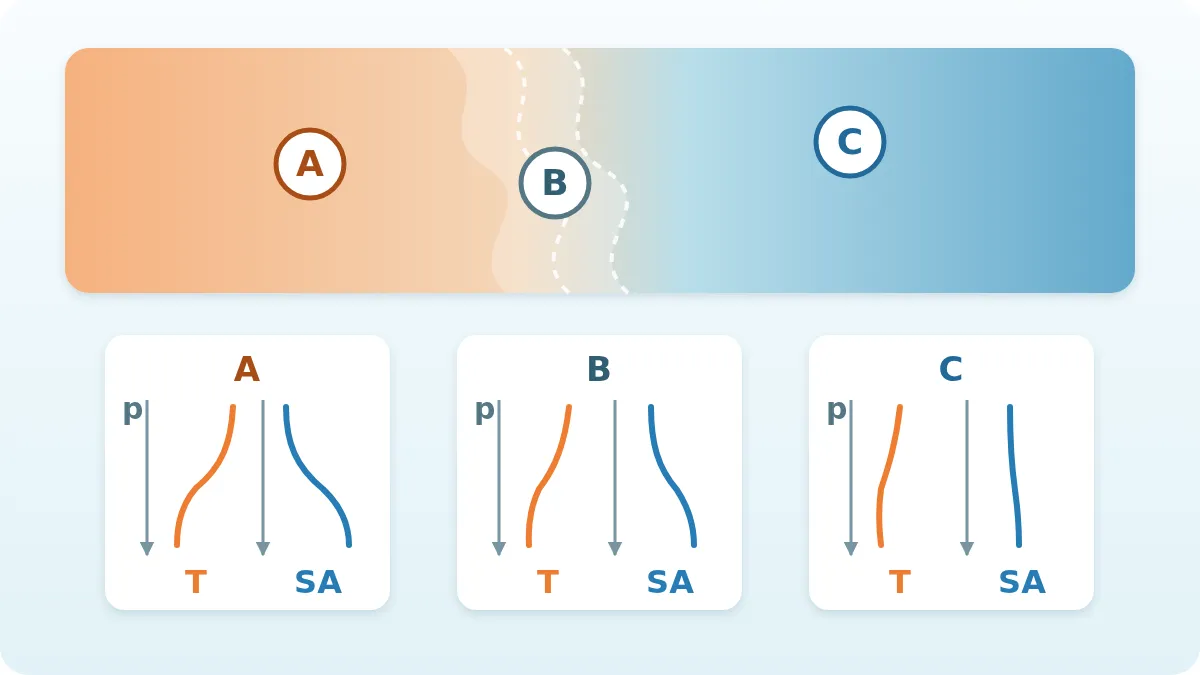
In many profiles, temperature decreases rapidly below the upper layer. This transition is the thermocline. A salinity transition is called a halocline, and the strongest density transition is a pycnocline.
These boundaries do not always occur at the same depth. A temperature gradient can be reinforced or partly offset by salinity. That is why oceanographers normally read temperature and salinity together before making a statement about density or stability.
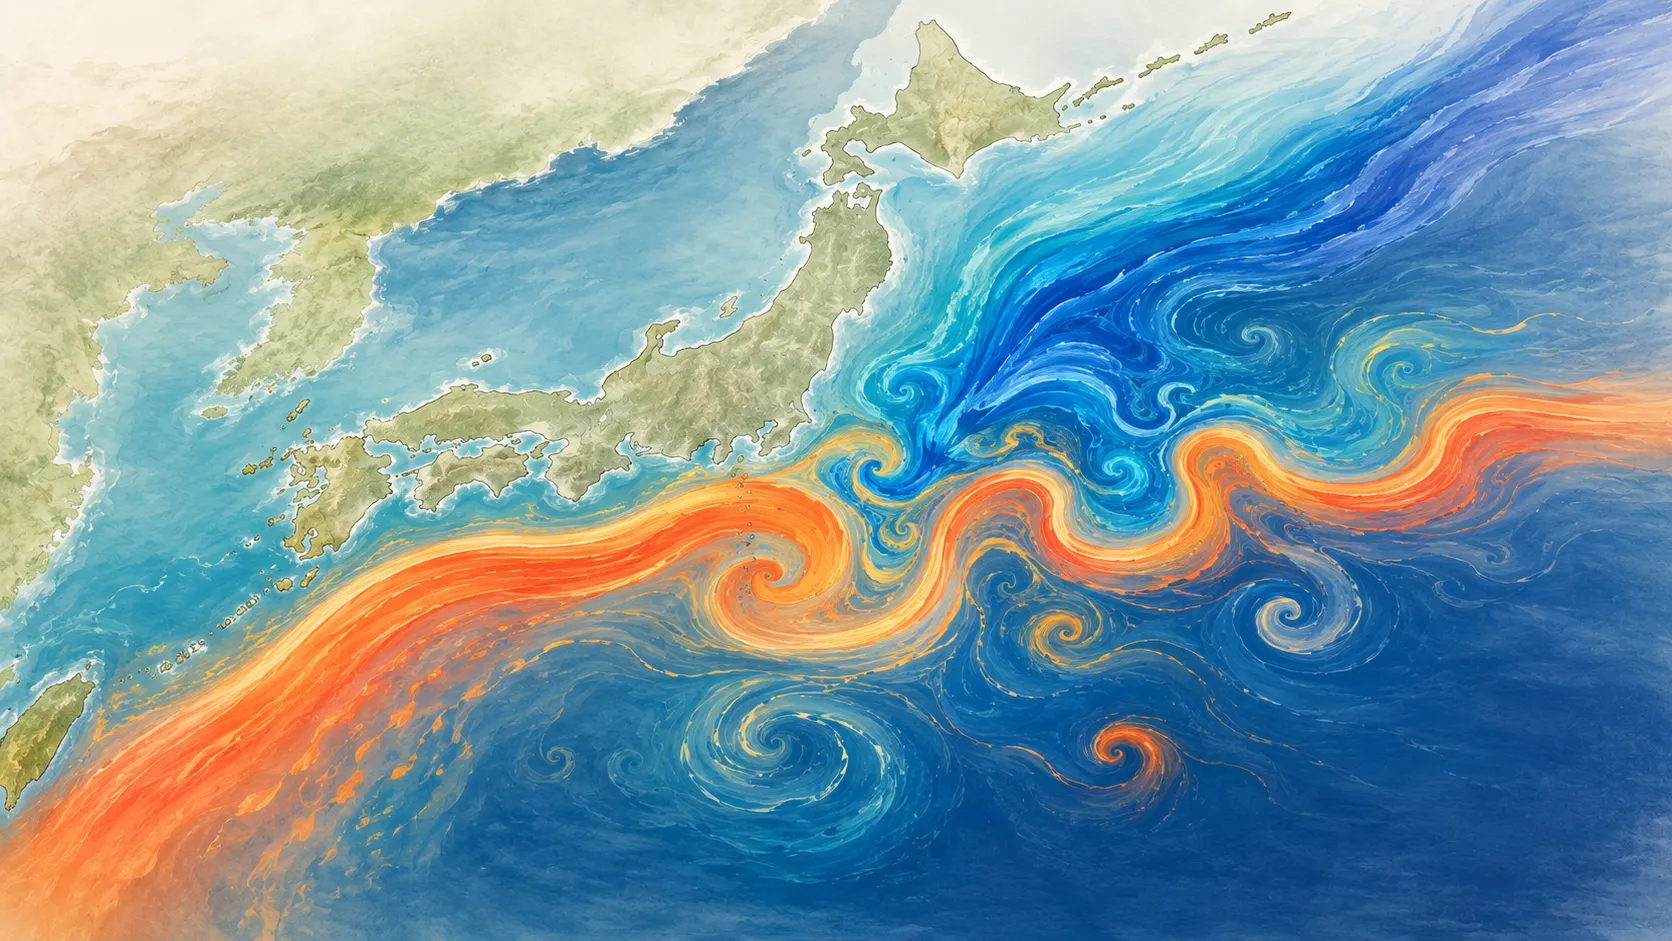
For a closer look at how ocean eddies displace these layers, see Ocean Eddies Below the Surface.
Ocean Upwelling and Nutrient Supply explains how winds can bring cooler water and nutrients toward the surface.
Deeper water often changes more slowly
Below the main transition, temperature commonly changes more gradually. Much of the water at around 1,000 to 2,000 meters has been isolated from daily weather for a long time and has been transported by large-scale ocean circulation.
Deep water is often cold because cold, dense water formed at high latitudes can sink and spread through the ocean interior. Intrusions, intermediate waters, geothermal settings, and polar conditions can produce different shapes. NOAA provides a concise introduction to why the ocean generally gets colder with depth.
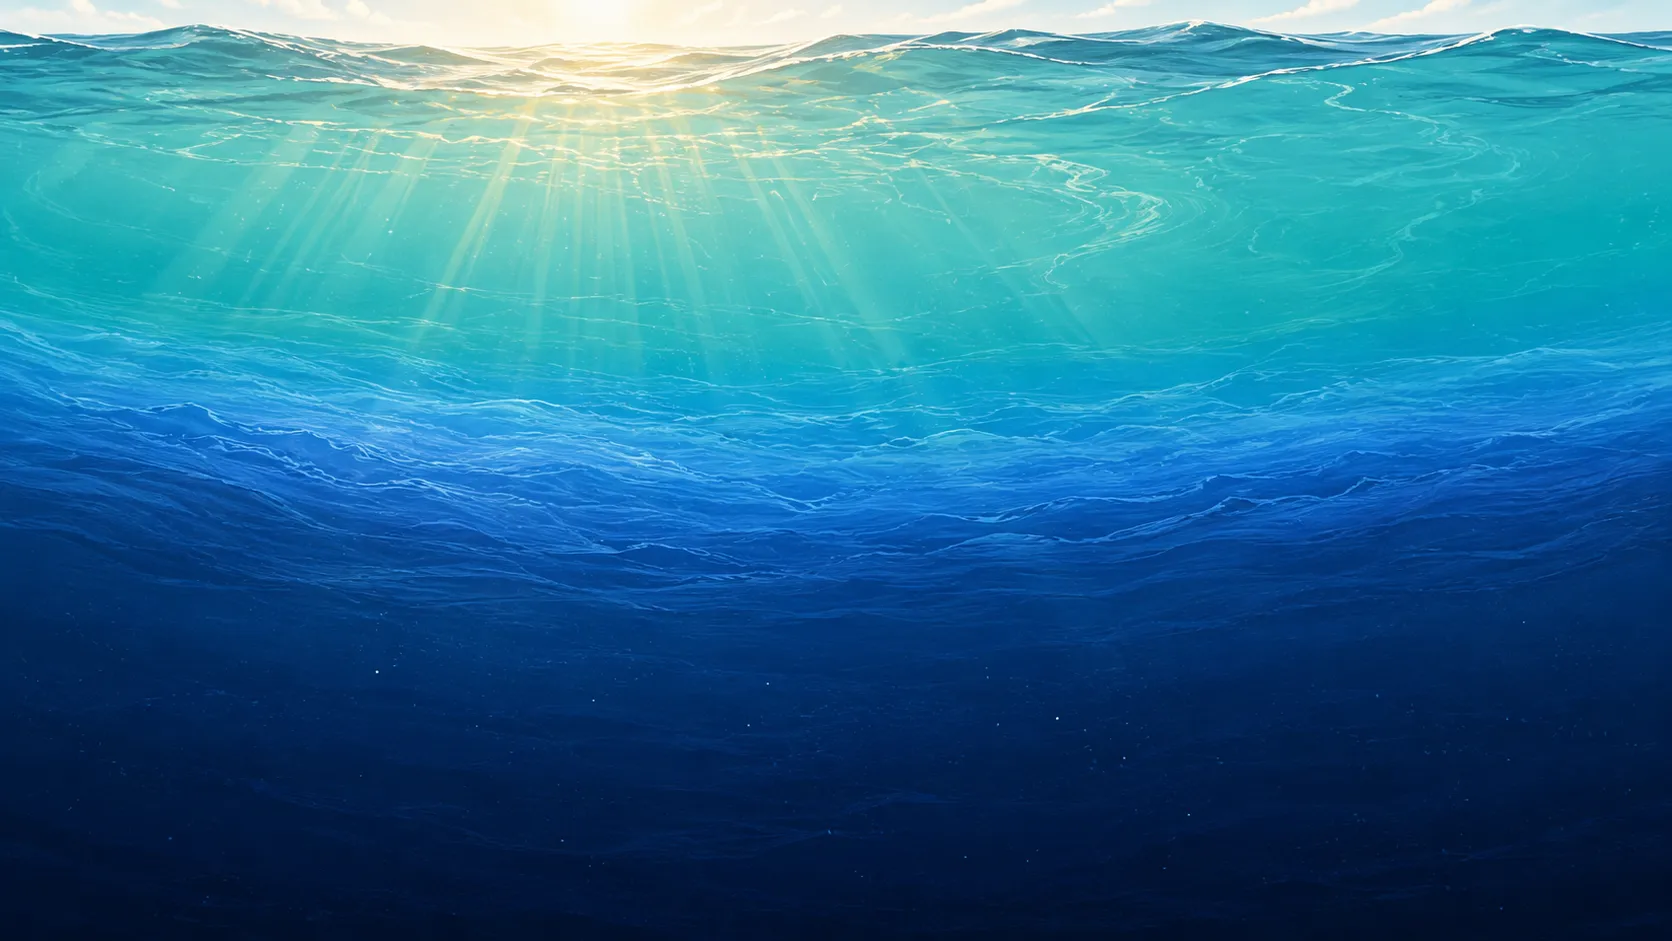
The illustration below brings the surface, transition, and deep layers together. Their thickness and boundary depths vary with place and time.
Salinity Does Not Follow One Simple Depth Pattern
Temperature often gives beginners a recognizable warm-to-cold shape. Salinity is less predictable.
A profile may contain:
- A fresh surface layer from rainfall, runoff, or melting ice
- Salty surface water where evaporation is strong
- A subsurface salinity maximum carried from another region
- An intermediate salinity minimum associated with a distinct water mass
- Slowly varying deep salinity
This variation is useful. Salinity can reveal structure that temperature alone misses, including the influence of different water origins and the global water cycle.
For a closer look at how the two properties work together, continue with How Temperature and Salinity Shape Seawater Density.
What a Vertical Profile Lets You Ask
A profile turns the vague question “what is below the surface?” into specific observations:
- How thick is the nearly uniform upper layer?
- Where does temperature change most rapidly?
- Does salinity change at the same depth?
- Are unusual maxima or minima present below the surface?
- Do two locations differ only near the top, or throughout the sampled water column?
The overall curve matters more than one isolated value. A surface temperature of 20°C, for example, does not tell you whether warm water ends at 20 meters or extends hundreds of meters downward.
The more detailed guide Ocean Temperature and Salinity Profiles Explained shows how to read these curve shapes step by step.
Pressure and Depth Are Close, but Not Identical
Argo floats directly measure pressure, usually reported in decibars (dbar). Profile plots often use pressure as the vertical coordinate because pressure increases as the float descends.
For a rough visual reading, 1 dbar is close to 1 meter in the upper ocean. They are not exactly interchangeable, and a quantitative conversion depends on latitude. OceanGraph retains profile values from 0 through 2,000 dbar, including both boundaries, while a standard Core Argo mission commonly profiles from roughly 2,000 meters toward the surface.
There Is No Single “Normal” Ocean Profile
Profiles differ because of:
- Latitude and season
- Nearby currents and fronts
- Wind and recent surface cooling
- Rainfall, evaporation, rivers, and ice
- Upwelling and downwelling
- The water masses present at depth
A tropical summer profile can have a warm, sharply layered upper ocean. A winter profile at mid-latitudes may have a much deeper uniform layer. At high latitudes, cold water can extend from the surface through much of the profile.
Those differences help reveal the ocean’s state.
See the Layers in Argo Profiles
Argo floats repeatedly measure pressure, temperature, and salinity as they rise through the water column. The International Argo Program describes the standard cycle and sensor system in How do floats work?.
In OceanGraph, a useful first comparison is:
- Search a small ocean region and a limited date range.
- Select one profile and note its place and date.
- Read the temperature curve from the surface downward.
- Check whether salinity changes at the same depths.
- Compare another profile from a different season or region.
The Search and Bookmark guide explains the available search controls. After you have compared a few profiles, How Deep Do Ocean Seasons Reach? is a natural next question.
The same vertical structure also connects to broader circulation and climate questions. What Causes Ocean Currents? explains how wind, rotation, and density differences move water, while What Does El Niño Look Like Below the Surface? follows the warm layer and thermocline across the equatorial Pacific.