On this page
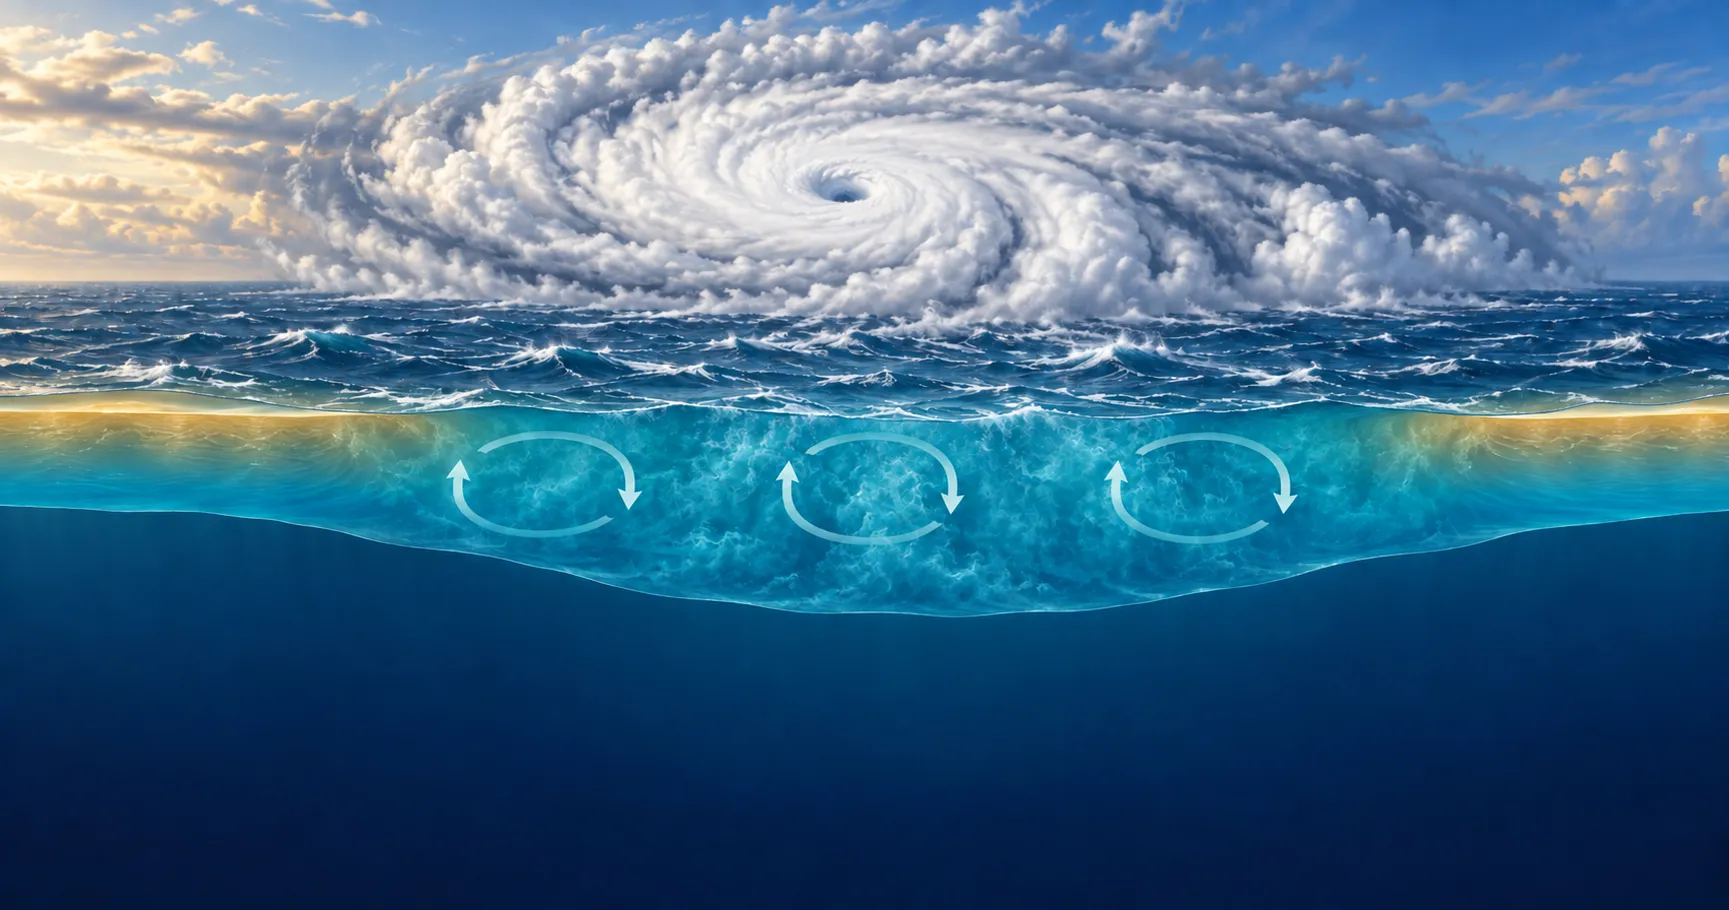
A typhoon can leave cooler water along its path by mixing the warm surface with colder water below, drawing deeper water upward, and increasing heat loss to the atmosphere. The result is often called a cold wake. Below that cooler surface, however, some layers may warm as heat is redistributed downward.
To understand the change, compare the shape of the water column before and after passage: the thickness of the nearly uniform upper layer, the temperature gradient below it, and the accompanying salinity structure. The same reasoning applies to hurricanes and other tropical cyclones. If profiles are unfamiliar, How Does the Ocean Change With Depth? introduces the axes and typical patterns.
Three Processes Can Cool the Surface
Strong winds drive currents and turbulence. When turbulent mixing incorporates colder water from below into the warm upper layer, the surface cools and the nearly uniform layer can deepen. This incorporation is called entrainment.
Upwelling works differently: deeper water moves upward, so a fixed shallow level can become colder even without homogenizing the layers. Wind-driven divergence beneath a storm can produce this response. Heat also leaves through the sea surface, including the latent heat carried away by evaporation. The Japan Meteorological Agency’s explanation of typhoon-induced cooling describes these mechanisms.
Their relative contributions vary. A colder surface alone cannot tell you how much heat escaped to the atmosphere and how much was moved elsewhere in the ocean.
Read the Shape, Not Only the Surface Value
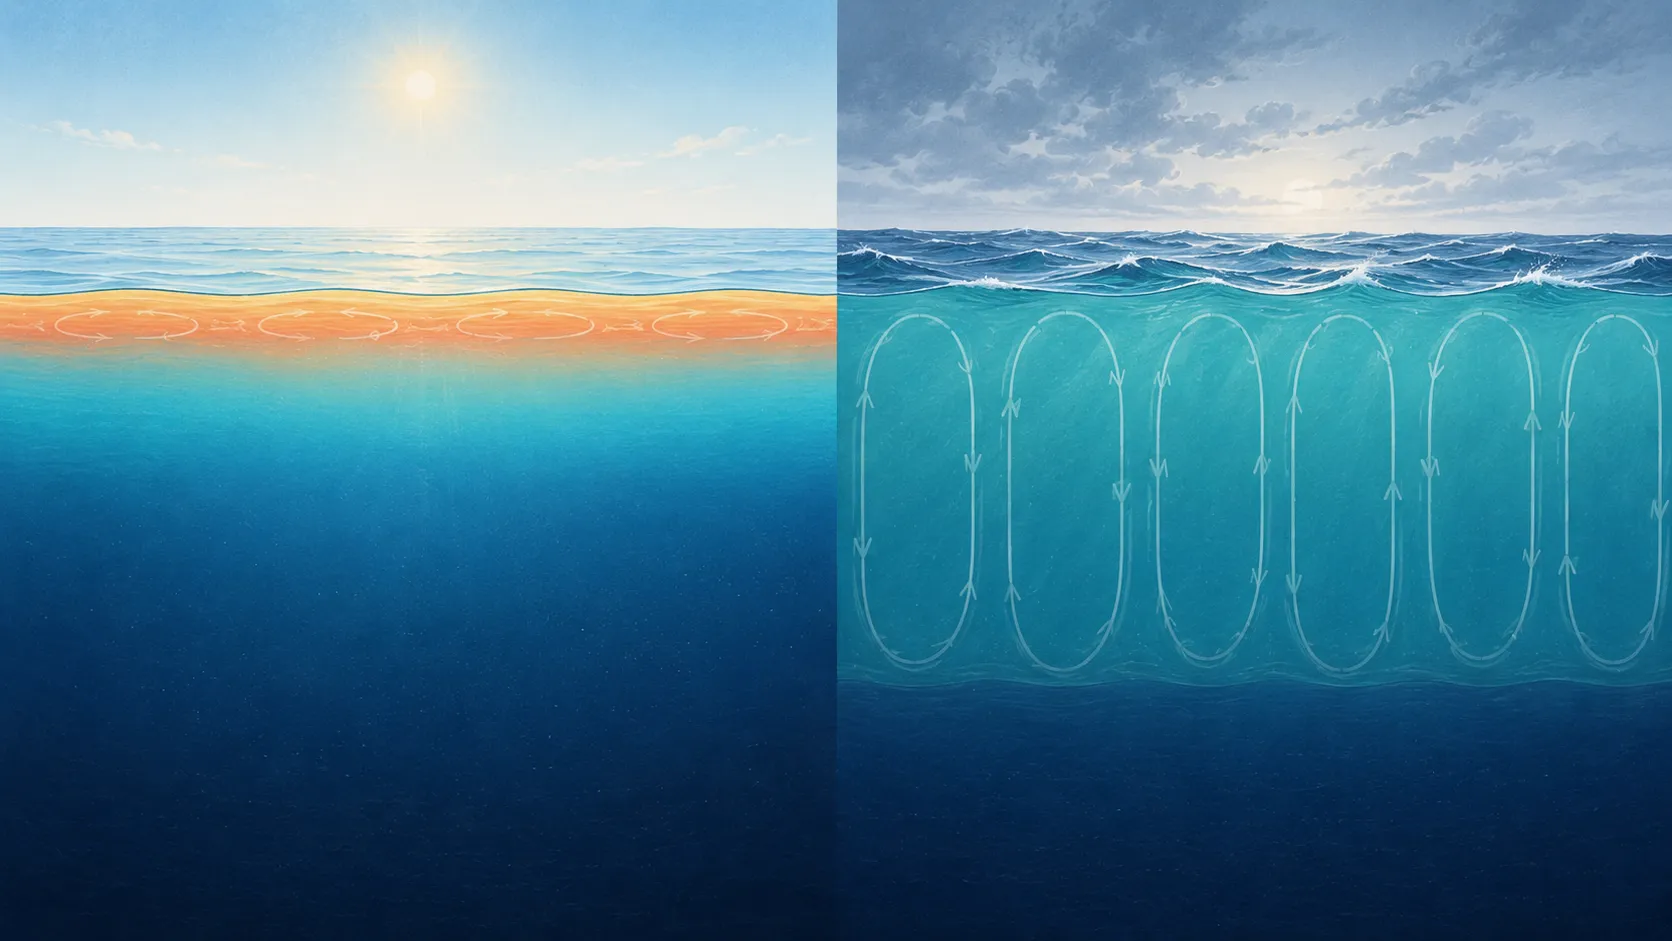
Consider a simplified, initially stratified water column with a thin warm layer over a thermocline. After mixing, the upper layer is cooler but extends farther downward. Water just below the former mixed layer can become warmer as surface heat reaches it.
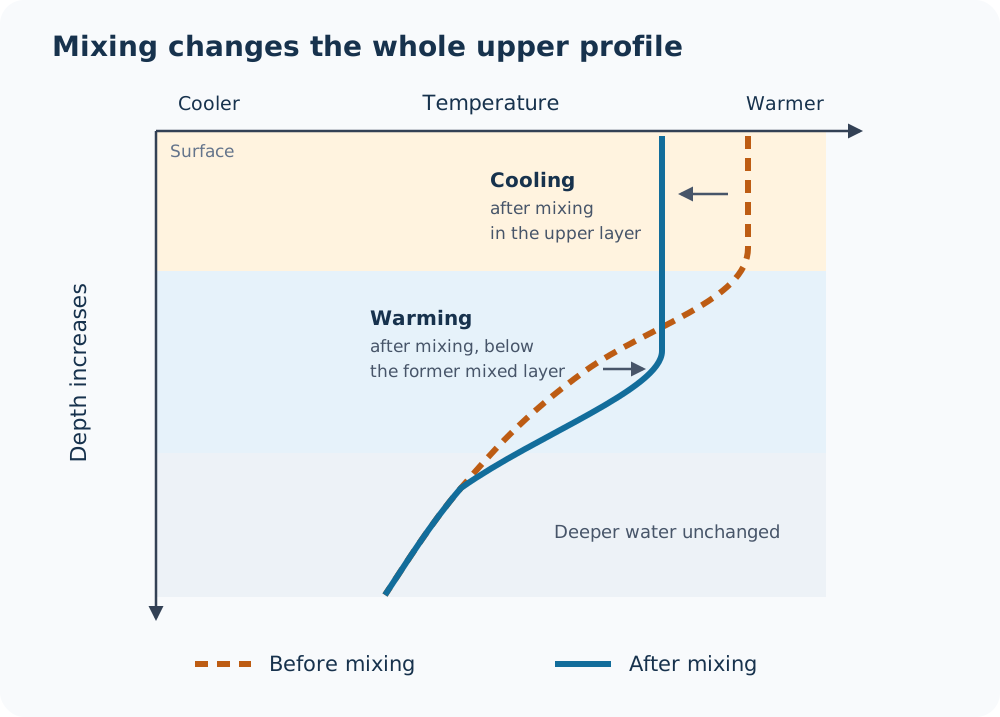
The dashed curve shows temperature before mixing; the solid curve shows it afterward.
An Argo-based analysis by Hu and colleagues describes both cooling and mixing-induced subsurface warming in the tropical-cyclone response. The coexistence of those changes is a reason to inspect more than the shallowest measurement.
Useful comparisons include:
| Profile feature | Interpretation to examine |
|---|---|
| A thicker layer with little temperature change | Mixing may have reached farther downward; check salinity too. |
| Similar gradients shifted upward | Vertical displacement may contribute to cooling at a fixed depth. |
| Cooler upper water and warmer water immediately below | Downward redistribution of heat may contribute. |
| Large salinity differences across much of the profile | Movement into a different water mass may complicate the comparison. |
These are clues to test with other measurements, not unique signatures of a typhoon. The mixed layer depth article explains why a single MLD value should be read alongside the full profiles.
Why Two Storms Leave Different Wakes
A thin warm layer above cold water offers a different starting point from warm water extending much deeper. With otherwise comparable forcing, mixing into colder water can produce stronger surface cooling. Storm speed, wind strength, and size also affect the response; NOAA/AOML’s discussion of tropical cyclone dynamic temperature explains why surface temperature and a fixed-depth average cannot capture all of these differences.
Salinity matters because it affects density. A fresh surface layer can stabilize the water column even where temperature changes little with depth, so a temperature-only view can overstate how deeply the water is mixed. Read temperature and salinity together before interpreting an apparent MLD change.
The distinction between heat redistribution and heat loss is developed in Why Sea Surface Temperature Is Not Enough to Measure Ocean Warming. Estimating a storm’s heat budget requires a specified depth range and treatment of transport and surface fluxes.
What Argo Research Has Observed
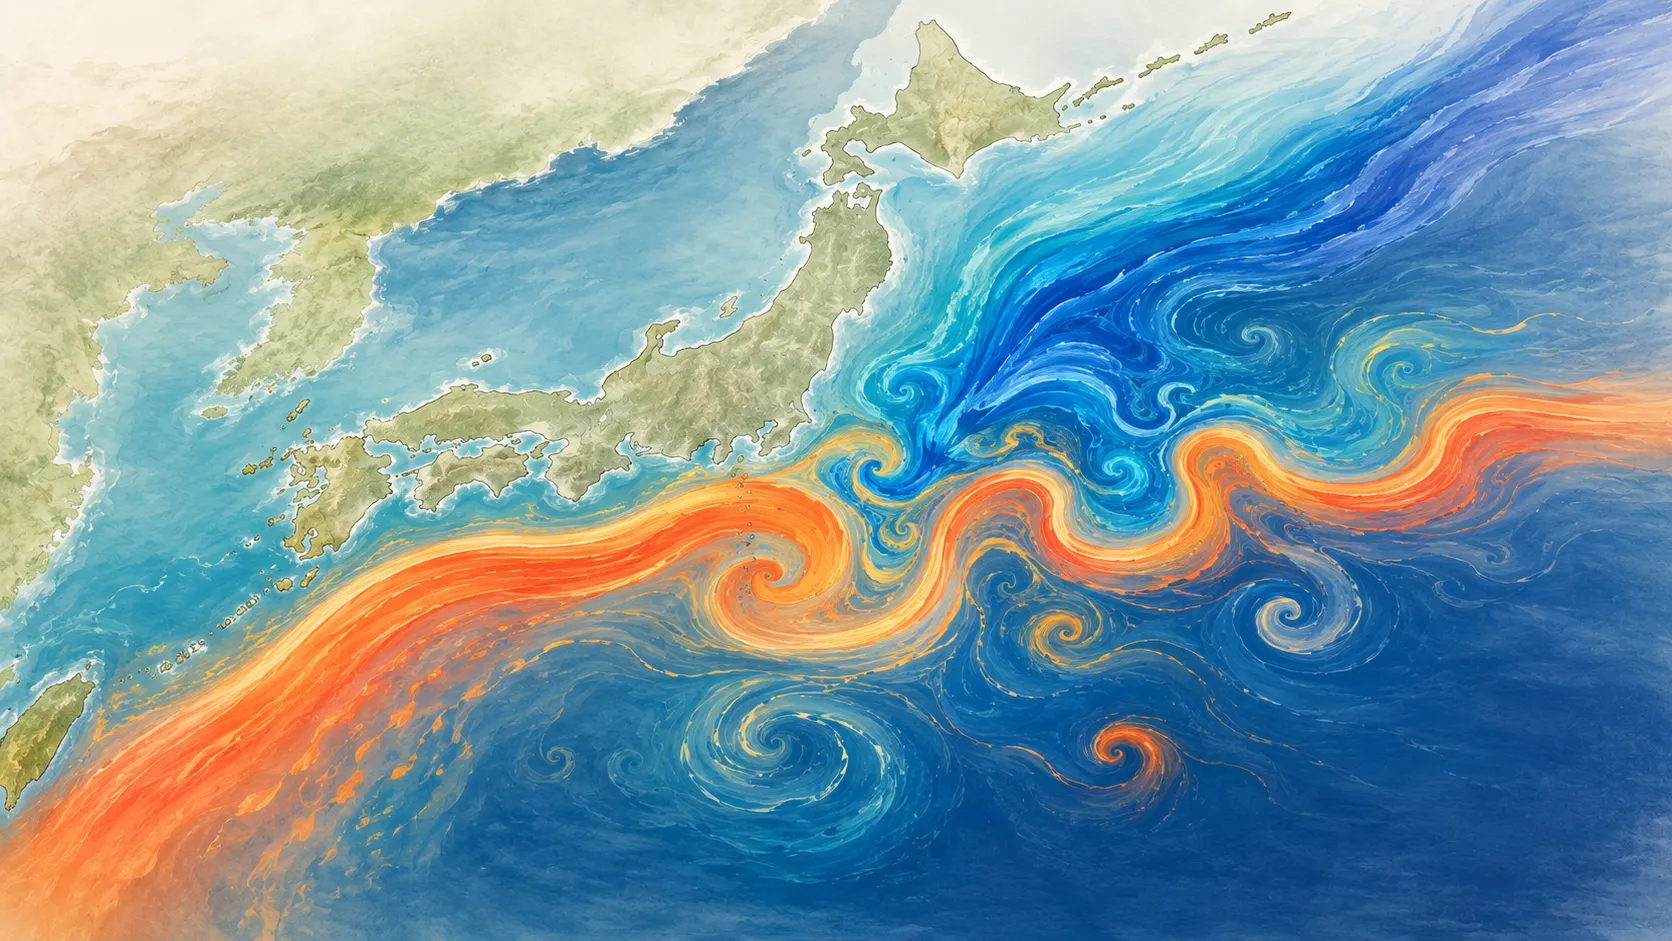
In a 2013 study published by the Japan Meteorological Agency, Shinya Minato examined roughly 4,400 Argo profiles near 253 northwestern Pacific typhoons during 2000–2010. Aligning the measurements relative to storm tracks revealed cooling that extended below the surface, with differences related to storm motion and latitude. There was also substantial variation among the individual measurements.
Find a Comparison You Can Interpret
Start with a past storm whose track and times are documented, for example in the JMA RSMC Best Track archive. Use that external record to choose a small search region and a period covering passage.
- Search the chosen region and dates, then identify a float with profiles on both sides of the passage time. Finding Argo Profiles by Location, Time, and WMO ID explains the available searches.
- Compare each profile’s UTC time and position with the storm’s passage time and track. Use the WMO ID and cycle number to identify the float and observation.
- Open the profile charts, then compare temperature and salinity over the same pressure range, including the upper layer and the transition below it. Check quality information and use consistent variables and processing. OceanGraph’s θ and S charts show potential temperature and absolute salinity.
- Open Trajectory, then Analyze > View section, to inspect the surrounding cycles. Read the dates and map positions alongside the section: equal steps in cycle number do not guarantee equal time intervals or repeated sampling of one location.
- Select MLD under Data layer as a comparison aid. OceanGraph uses the shallowest crossing of its temperature, salinity, and density criteria.
The Search and Bookmark, Trajectory and Time-Series Vertical Section, and Mixed Layer Depth guides describe the controls and calculation conditions. On narrow layouts, the relevant map commands are grouped under Tools.
Keep the Sampling Interval in the Conclusion
The standard Argo mission samples roughly every ten days while the float drifts between profiles. A storm can pass and the upper layer can begin recovering within that interval. Check the actual timestamps: the nearest available pair may miss the strongest response, or its difference may include seasonal change and horizontal movement.
A smooth-looking section cannot reconstruct the unobserved passage between cycles. OceanGraph interpolates vertically within supported measurements; it does not fill missing cycles through time.
An exploration result might read: the later profile has a cooler, deeper nearly uniform upper layer, consistent with mixing. Determining the storm’s contribution quantitatively requires quality-controlled data, appropriate background comparisons, and uncertainty estimates.