On this page
The ocean has seasons below the surface, but their reach is limited. Summer sunlight often creates a warm, shallow cap, while winter cooling and stronger winds can mix the upper ocean to much greater depth. Below the seasonally affected layer, temperature and salinity usually change more slowly through the year.
There is no single depth that applies everywhere. In some regions the seasonal signal is only tens of meters thick; elsewhere winter mixing extends hundreds of meters.
Why Summer and Winter Produce Different Profiles
The contrast begins with the different ways heat and turbulence reshape the upper ocean.
Summer builds a warm surface cap
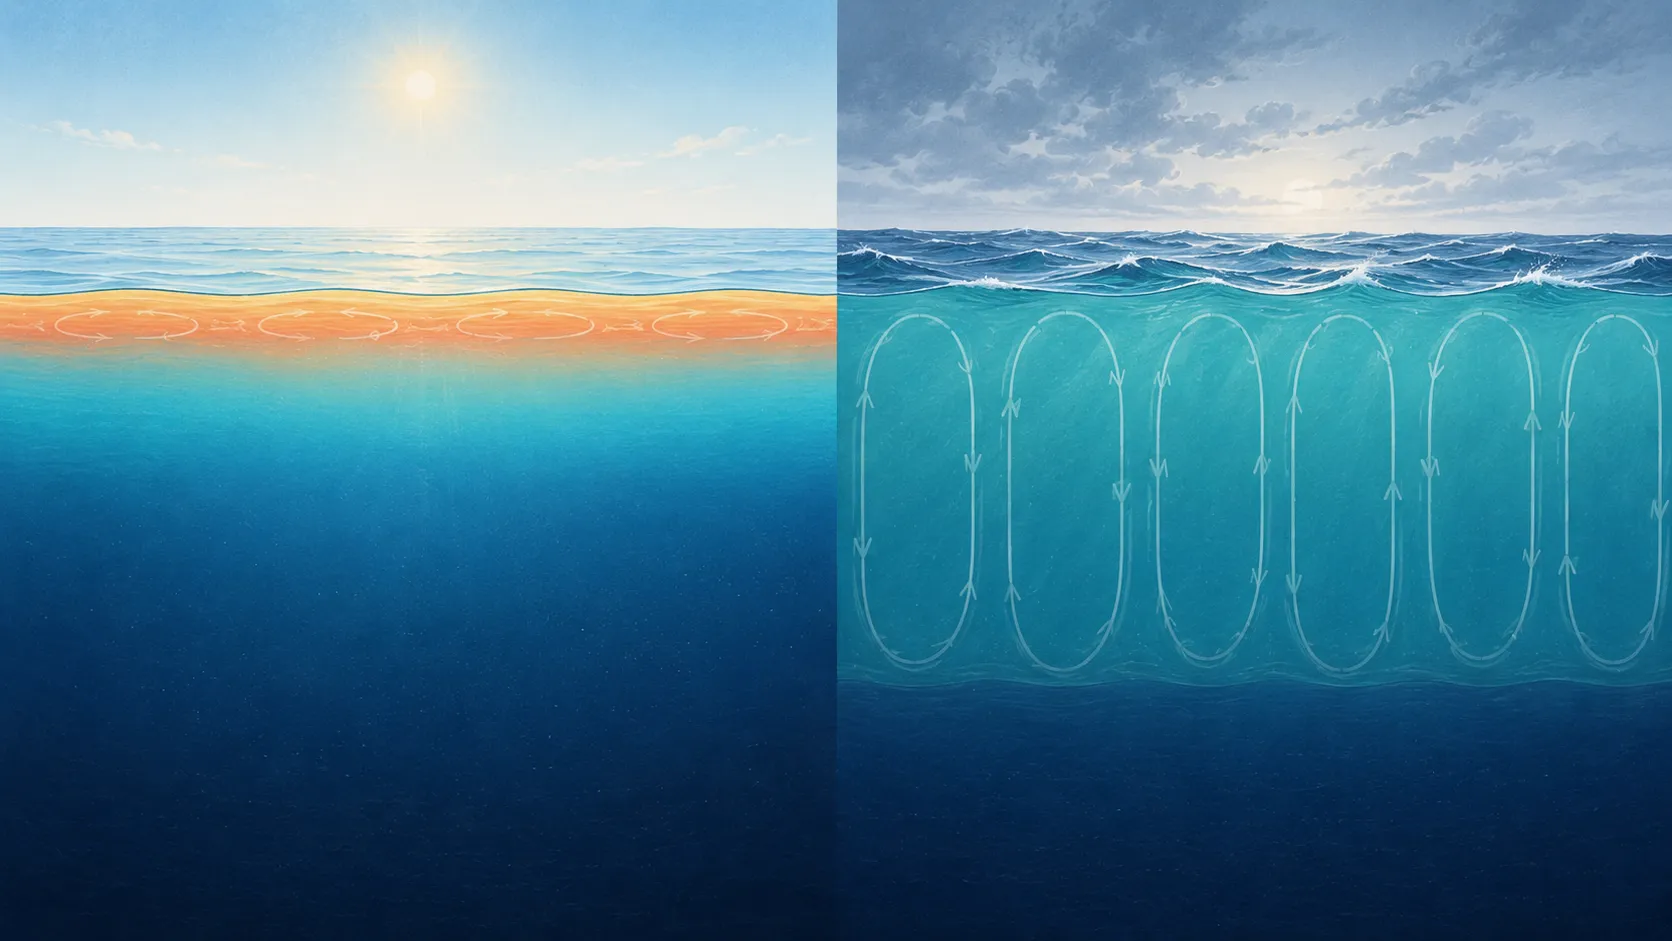
Sunlight warms the ocean from above. When heating is strong and mixing is not deep enough to distribute that heat, the surface becomes lighter than the colder water below.
The typical profile has:
- A warm, shallow upper layer
- A sharp temperature decrease below it
- A shallow mixed layer
- Deeper water that has changed much less
The sharp seasonal transition is a seasonal thermocline. It can make the sea-surface temperature respond quickly to a sunny period because the heat is concentrated in a relatively small volume of water.
Winter erodes the summer layering
In winter, the surface loses heat and often experiences stronger winds. Cooling makes surface water denser, while wind and waves supply turbulence. Together they can mix the water column downward and weaken the shallow summer thermocline.
The winter profile often has:
- A cooler surface
- A thicker layer with nearly uniform temperature and salinity
- A deeper mixed layer
- A transition to more persistent water below
The Japan Meteorological Agency’s explanation of the surface mixed layer gives a regional example: in its 1982–2010 climatology around Japan, summer mixed layers are commonly around 10–20 meters, while winter mixed layers exceed 100 meters across broad areas.
The illustration below summarizes the shallow summer layer and deeper winter mixing above water that changes less through the year.
What Determines How Deep the Season Reaches
The depth depends on more than the calendar.
Latitude and sunlight
Seasonal heating and cooling are generally stronger at mid and high latitudes than in the tropics. Tropical profiles may retain a persistent thermocline, while temperate regions often develop a pronounced seasonal one.
Wind and surface heat loss
Strong wind increases turbulent mixing. Strong cooling reduces the buoyancy of the surface water and can trigger convection. Both processes favor a deeper mixed layer.
Rain, evaporation, and ice
Freshwater can make the surface lighter and resist mixing even when the water is cool. Evaporation can increase surface salinity and density. Sea-ice formation and melt add further regional effects.
Currents and water masses
A current or eddy can move a different water mass into the region. A profile difference between two dates may therefore reflect both the seasonal cycle and changing geography.
The Mixed Layer Is the Key Depth
The mixed layer is the near-surface layer whose properties have been made relatively uniform by turbulence. Its lower boundary is summarized by the mixed layer depth (MLD).
MLD is useful because it converts a full profile shape into one comparable indicator. Different threshold definitions can produce somewhat different values, and profiles without enough near-surface data may not support an MLD calculation.
For the concept and OceanGraph’s current calculation contract, see Mixed Layer Depth (MLD) Explained and the Mixed Layer Depth App Guide.
Surface Change Is Not Whole-Ocean Change
Seasonal warming can be dramatic at the surface while becoming small below the seasonal thermocline. This matters whenever a surface measurement is used to describe the entire upper ocean.
Two days or seasons with similar sea-surface temperature can also have different subsurface structures:
- One may have a thin warm layer above cold water
- The other may have warm water extending much deeper
The second water column contains more heat even if the surface thermometer reads the same value. This is one reason Sea Surface Temperature Is Not Enough to Measure Ocean Warming.
How to Compare Seasons Without Misreading the Data
A careful comparison uses:
- Similar geographic bounds
- Comparable months from different years, or summer and winter within a clear regional question
- Temperature and salinity together
- More than one profile
- Profile dates and positions
One summer profile and one winter profile can illustrate the idea, but they do not define the climatology of a region. Weather, eddies, and the float’s movement may make either profile unusual.
See Seasonal Structure in Argo Data
Argo floats repeatedly profile the water column, so they can show how the upper ocean changes over many cycles. In OceanGraph, two views are especially helpful.
Compare profiles from the same region
Search the same geographic box once for a summer period and once for a winter period. Compare:
- The thickness of the nearly uniform upper layer
- The depth of the strongest temperature gradient
- Whether salinity reinforces or opposes the temperature layering
- How similar the deeper parts of the profiles remain
Follow a float through a sequence
A time-series vertical section places repeated profiles into one depth-versus-cycle view. It can make seasonal shoaling and deepening easier to see, but the float moves geographically. The pattern therefore combines time and location.
The Trajectory and Time-Series Vertical Section guide explains the feature. Time-Series Vertical Sections in Oceanography Explained covers the interpretation and missing-data limits.