On this page
Sea surface temperature tells us how warm the top of the ocean is. It does not tell us how much heat is stored below. Two water columns can have the same surface temperature while one contains a thin warm layer and the other remains warm hundreds of meters downward.
To describe ocean warming, scientists therefore use both surface temperature and measurements through depth. One of the key quantities is ocean heat content, which depends on temperature changes across a volume of seawater rather than at a single surface level.
The Same Surface Temperature Can Hide Different Oceans
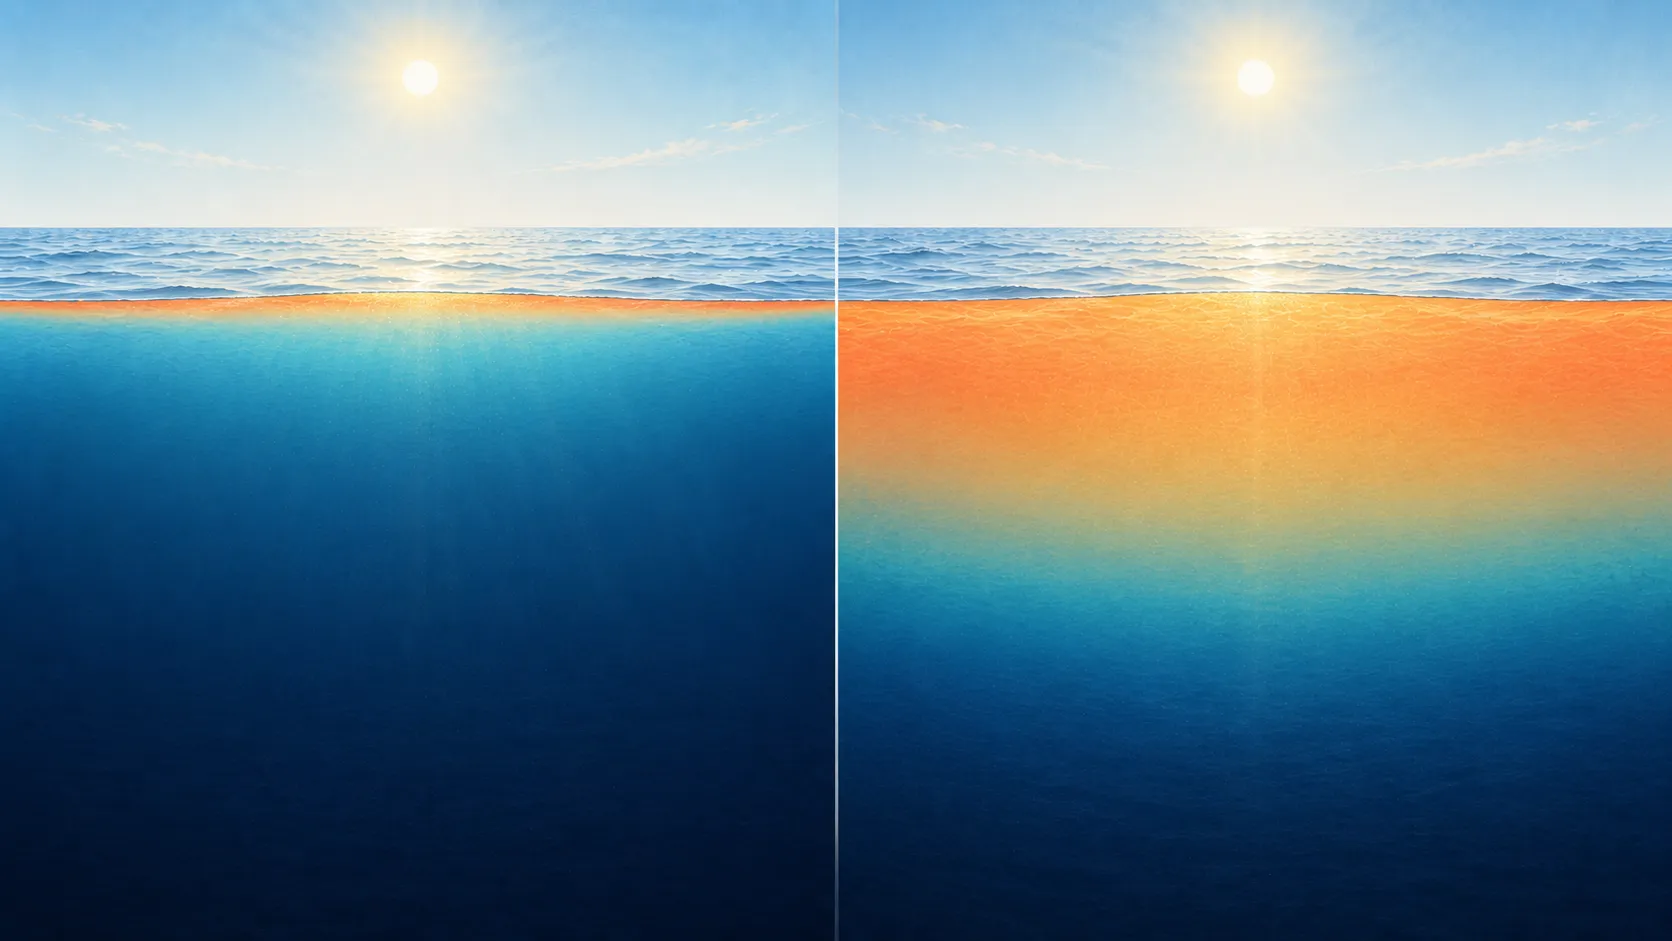
Imagine two locations with the same sea surface temperature.
- At location A, a warm layer is only a few tens of meters thick, with much colder water immediately below.
- At location B, warm water extends several hundred meters downward.
The surface reading is the same, but location B stores more heat in the upper ocean. A profile makes that difference visible; a surface value alone does not.
The illustration below shows how the same surface reading can sit above either a thin warm layer or a much deeper one.
Sea surface temperature is a valuable measure of air-sea interaction, currents, fronts, marine heatwaves, and conditions affecting weather and ecosystems.
Marine Heatwaves Below the Surface focuses on unusually warm events: how they are defined against seasonal conditions and how warmth can persist below the surface.
Temperature Is a Value; Heat Content Includes Volume
Temperature describes the thermal state of water at a point. Heat content depends on:
- The temperature anomaly relative to a reference
- The amount of water affected
- Seawater density and heat capacity
- The depth range being integrated
Warming a very thin surface layer and warming a thick layer by the same number of degrees do not add the same amount of heat to the ocean.
NOAA’s Ocean Heat Content, Salt Content, and Sea Level Anomalies explains how subsurface temperature observations are used to estimate heat-content change and the related contribution of thermal expansion to sea level.
Why the Surface and Interior Can Change Differently
Heat moves between the atmosphere and ocean at the surface, but it does not remain there.
Wind, waves, convection, currents, eddies, and large-scale circulation redistribute heat horizontally and vertically. As a result:
- Short weather events can change the surface quickly
- Summer warming may remain in a shallow layer
- Winter mixing can carry surface changes deeper
- Currents can move heat away from where it entered
- Subsurface layers can warm even when local surface change is small
The seasonal structure described in How Deep Do Ocean Seasons Reach? is a short-timescale example of why depth matters.
What Does El Niño Look Like Below the Surface? applies the same distinction to the equatorial Pacific, where thermocline depth and the distribution of warm water change along with sea-surface temperature.
How the Ocean Interior Is Measured
Satellites provide broad and frequent surface observations. Measurements below the surface come from research ships, moorings, autonomous instruments, and profiling floats.
Argo is especially important because its floats repeatedly sample temperature and salinity through the upper and middle ocean across broad regions. The Argo Program describes monitoring ocean heat content as one of the major uses of its global array in Argo and climate change.
For an introduction to how these platforms complement each other, see How Do Scientists Measure the Ocean?.
Data Needed to Assess Climate-Scale Change
Climate-scale conclusions require:
- Long, consistently processed records
- Broad geographic coverage
- Quality control and bias correction
- Comparisons with a suitable baseline
- Uncertainty estimates
- Methods that account for uneven sampling
Differences between profiles may reflect season, location, an eddy, sensor coverage, or a longer-term change. Trend analysis must separate those effects.
Sea Surface Temperature and Heat Content Answer Different Questions
| Question | Useful quantity |
|---|---|
| What is the thermal condition at the ocean surface? | Sea surface temperature |
| How deep does a warm layer extend? | Temperature profile |
| How much thermal energy is stored over a depth range? | Ocean heat content |
| Is the ocean warming over decades? | Quality-controlled, spatially representative long-term records |
Explore the Vertical Context Before Doing Trend Analysis
OceanGraph lets you inspect the vertical structure in real Argo profiles.
A focused exploration is:
- Choose a small region and limited date range.
- Select profiles with similar surface temperatures.
- Compare how far the warm water extends downward.
- Check salinity, because it affects density and mixing.
- Compare the profile locations and dates before interpreting the difference.
The Search and Bookmark guide explains the search controls. How Does the Ocean Change With Depth? gives the profile-reading foundation.