On this page
A marine heatwave is a sustained period of unusually warm seawater for a particular place and time of year. The unusual warmth can be concentrated near the surface, extend deeper, or remain below after the surface has cooled. To understand an event, we need to know how far temperatures depart from their usual range, at which depths, and for how long.
What Makes Warm Water a Marine Heatwave?
A widely used framework from Hobday and colleagues (2016) identifies an event when temperature exceeds a seasonally varying 90th-percentile threshold for at least five consecutive days. The authors recommend a 30-year historical baseline where possible. If two periods that each meet the five-day criterion are separated by only one or two days at or below the threshold, their method joins them into a single event, including the brief interruption.
The threshold marks the upper tenth of the historical temperature distribution for that location and time of year. It is not a single temperature applied to every ocean. An unusually warm winter can qualify, while an ordinary hot summer need not. The baseline period affects what counts as unusual, so comparisons between studies require compatible baselines and methods.
This distinction also matters below the surface. A temperature anomaly is the observed temperature minus the long-term seasonal mean at the same location and depth. A positive anomaly means warmer than that reference; it does not, by itself, establish that a heatwave threshold or duration criterion has been met.
How Deep Can the Unusual Warmth Reach?
There is no fixed depth for a marine heatwave. In an analysis combining satellite observations and Argo profiles, Zhang and colleagues (2023) found several vertical patterns: warming confined to shallow water, warming extending deeper, a maximum anomaly below the surface, and even surface warming with anomalously cold water underneath.
Depth must therefore be assessed relative to the usual temperature at each level. Water at 200 meters can be colder than the surface and still be unusually warm for 200 meters. The profile-reading foundations are explained in How Does the Ocean Change With Depth?.
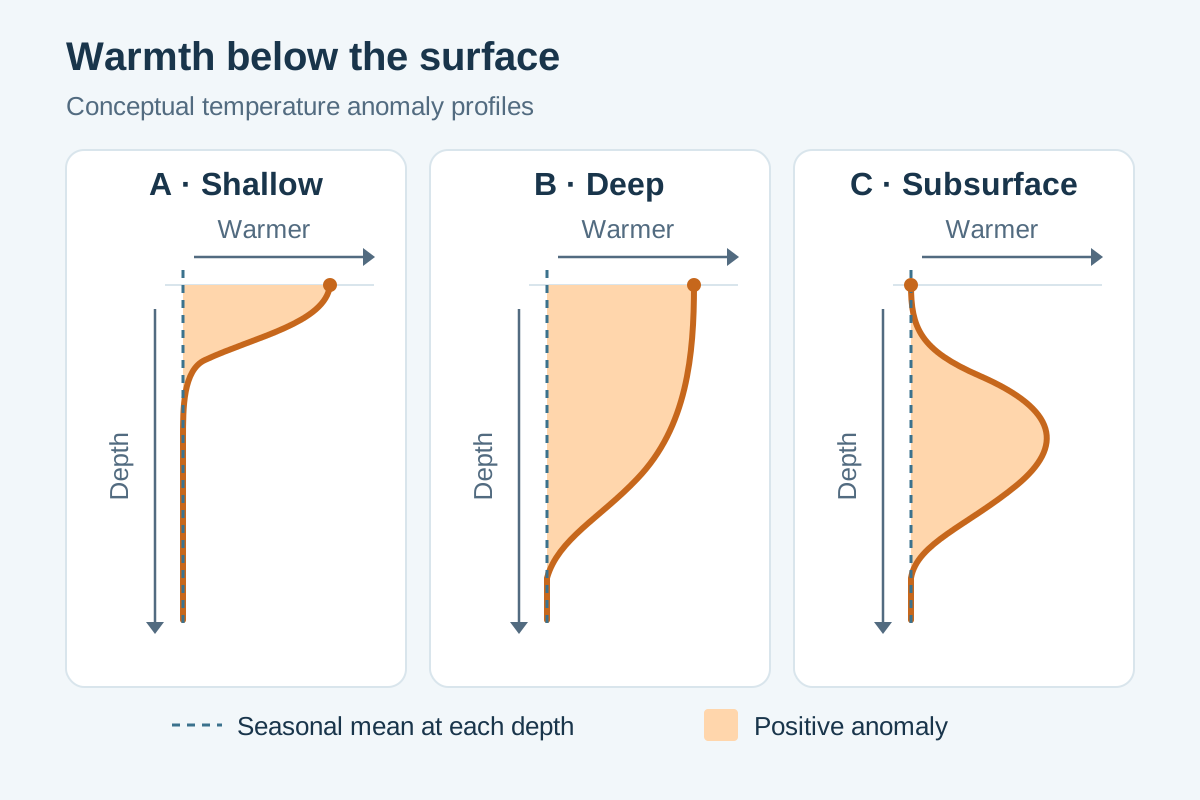
The first two profiles have the same surface anomaly but different vertical extents. The third has a positive anomaly below a surface near its seasonal mean. The dashed line marks the seasonal mean at each depth; it does not represent the marine heatwave threshold.
Three comparisons help describe the vertical structure:
- Anomaly magnitude: how much warmer the water is than its seasonal mean at each depth
- Vertical extent: the depth range over which unusual warmth occurs
- Persistence: how long the anomaly, or a specified heatwave threshold exceedance, lasts at each depth
Ocean heat-content anomaly adds another perspective by integrating temperature anomalies relative to the chosen seasonal baseline over a volume, accounting for seawater density and heat capacity. A large surface anomaly in a thin layer need not imply more excess heat than a smaller anomaly in a thick layer. See Why Sea Surface Temperature Is Not Enough to Measure Ocean Warming for that distinction.
Why the Surface and Subsurface Can Differ
Heat can accumulate because the ocean gains more heat from the atmosphere, loses less heat to it, or receives warm water carried by currents. Changes in mixing and the movement of ocean layers also influence the temperature at a given depth. Their relative importance varies among events, as described in Holbrook and colleagues’ assessment of marine heatwave drivers.
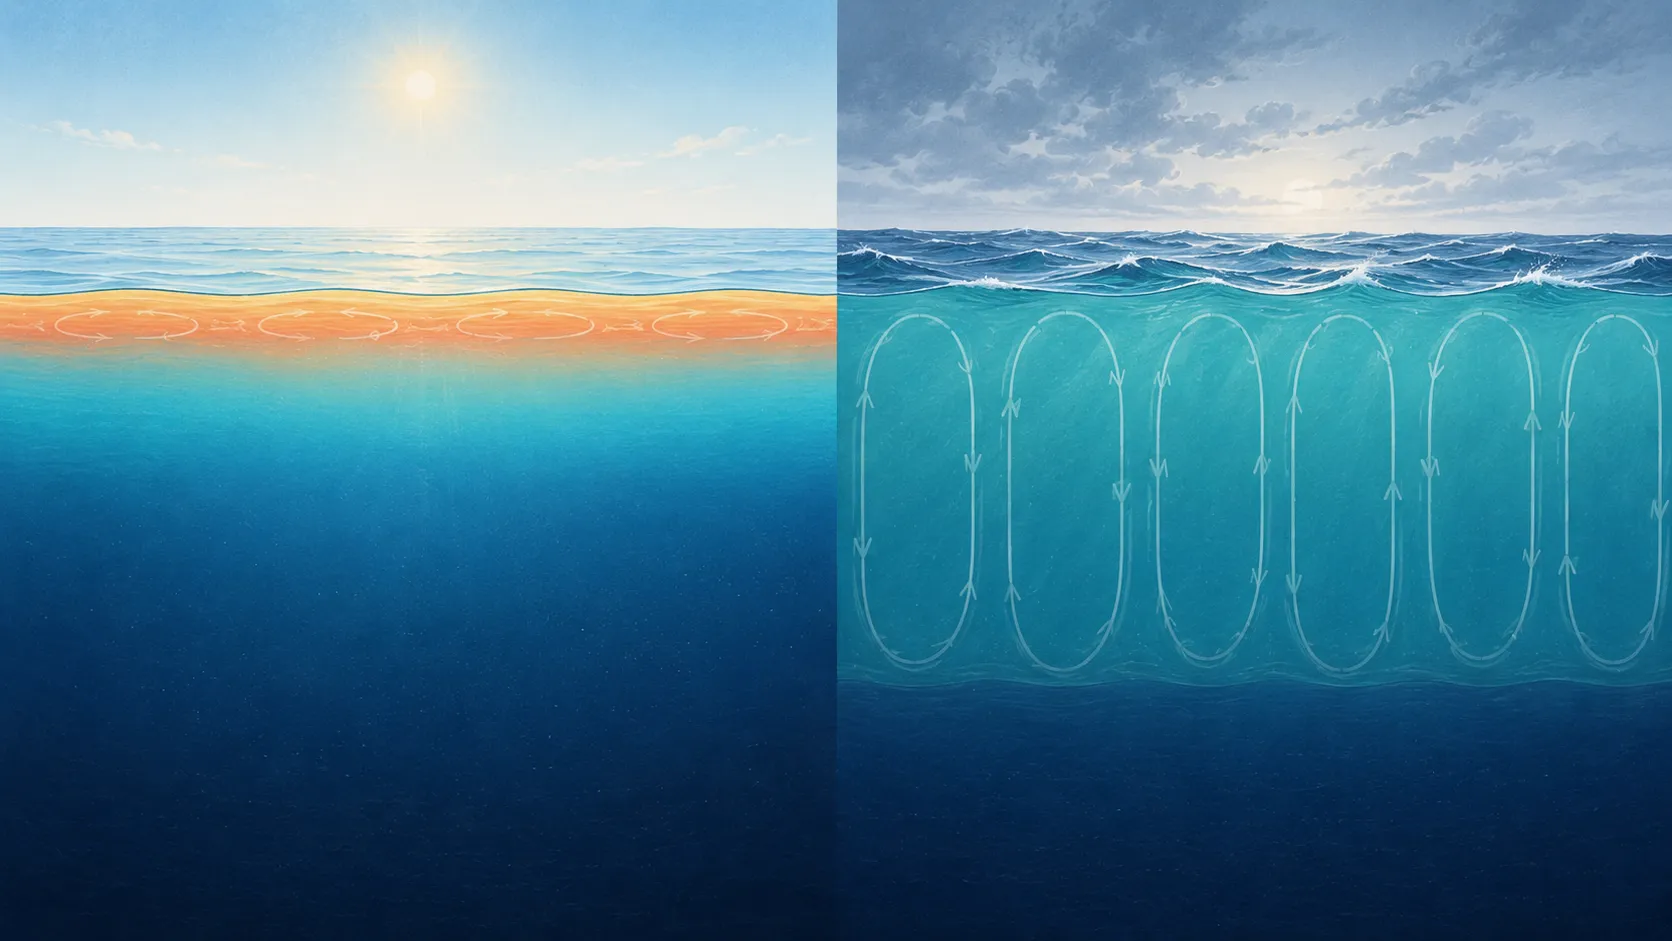
Salinity matters because it contributes to density. A fresh surface layer can strengthen stratification and restrict mixing with deeper water. Surface warming can then be intense while affecting a relatively shallow layer.
Two northeast Pacific events show why salinity matters
Scannell and colleagues (2020) compared the northeast Pacific events of 2013–2016 and 2019–2020 using mapped Argo temperature and salinity data. Although their surface warming was of similar magnitude, an unusually fresh upper layer in the Gulf of Alaska during 2019 increased stability. The authors interpreted this stronger stratification as a likely reason why the warming did not reach as deeply as in the earlier event.
The study also described the gradual accumulation of subsurface heat during the first half of 2020, with observations extending through June. Warm anomalies below the surface can outlast the surface event, so the end date on a surface heatwave map need not describe recovery throughout the water column.
What Argo Profiles Can Establish
Argo adds repeated measurements through depth to the broad surface coverage available from satellites. Standard float missions commonly profile about every ten days while drifting with currents, as described by the Argo Program.
That sampling is useful for examining the vertical structure of an already documented event. However, two warm profiles ten days apart do not demonstrate five consecutive warm days at one location. Nor does a warmer profile automatically show a local change through time: a drifting float may have crossed a front or entered an eddy.
Event detection requires a temperature record with suitable time resolution and a seasonal baseline. For a subsurface analysis, the baseline must also resolve depth and use the same temperature variable as the observations. Measurements from nearby floats and other observing systems help distinguish regional evolution from changes along one float’s path.
Explore the Vertical Structure in OceanGraph
A practical starting point is the Gulf of Alaska during the late summer of 2019, within the event studied by Scannell and colleagues. Choose a small offshore area and a short search window, such as September 2019. The profiles available in that window determine which floats can be followed.
- Select a profile and inspect θ, the potential temperature profile, together with salinity. Compare the thickness of the upper warm layer and any fresh surface layer.
- Turn on Trajectory, then open Analyze → View section to follow the selected float through its published cycles. Use the section’s θ and S controls to compare temperature and salinity structure.
- Compare summer profiles with later profiles, checking the dates and map positions as you move between cycles. Look for changes in the depth of the warm layer and whether they coincide with changes in salinity or location.
These charts show the measured water-column structure using processed profile variables. Their warm colors represent higher values, not departures from a climatological baseline. To quantify a heatwave anomaly, compare the profiles with a matching seasonal reference in a separate analysis; ordinary seasonal cooling can occur while water remains warmer than usual.
The Search and Bookmark guide explains the search controls, and the Trajectory and Time-Series Vertical Section guide explains the linked maps and sections. For interpreting the seasonal changes alongside the event, continue with How Deep Do Ocean Seasons Reach?.