On this page
The Kuroshio carries warm subtropical water northward along Japan, while the Oyashio brings colder subpolar water southward. Their contrast is visible at the sea surface, but it also extends downward through differences in temperature, salinity, oxygen, and the arrangement of water masses.
Two Currents, Two Broad Water Origins
The Kuroshio is the western boundary current of the North Pacific subtropical circulation. It flows through the East China Sea and along the south coast of Japan before continuing eastward as the Kuroshio Extension.
The Oyashio is associated with the North Pacific subpolar circulation. It brings cold subpolar water southwestward along the Kuril Islands and toward the waters east of northern Japan.
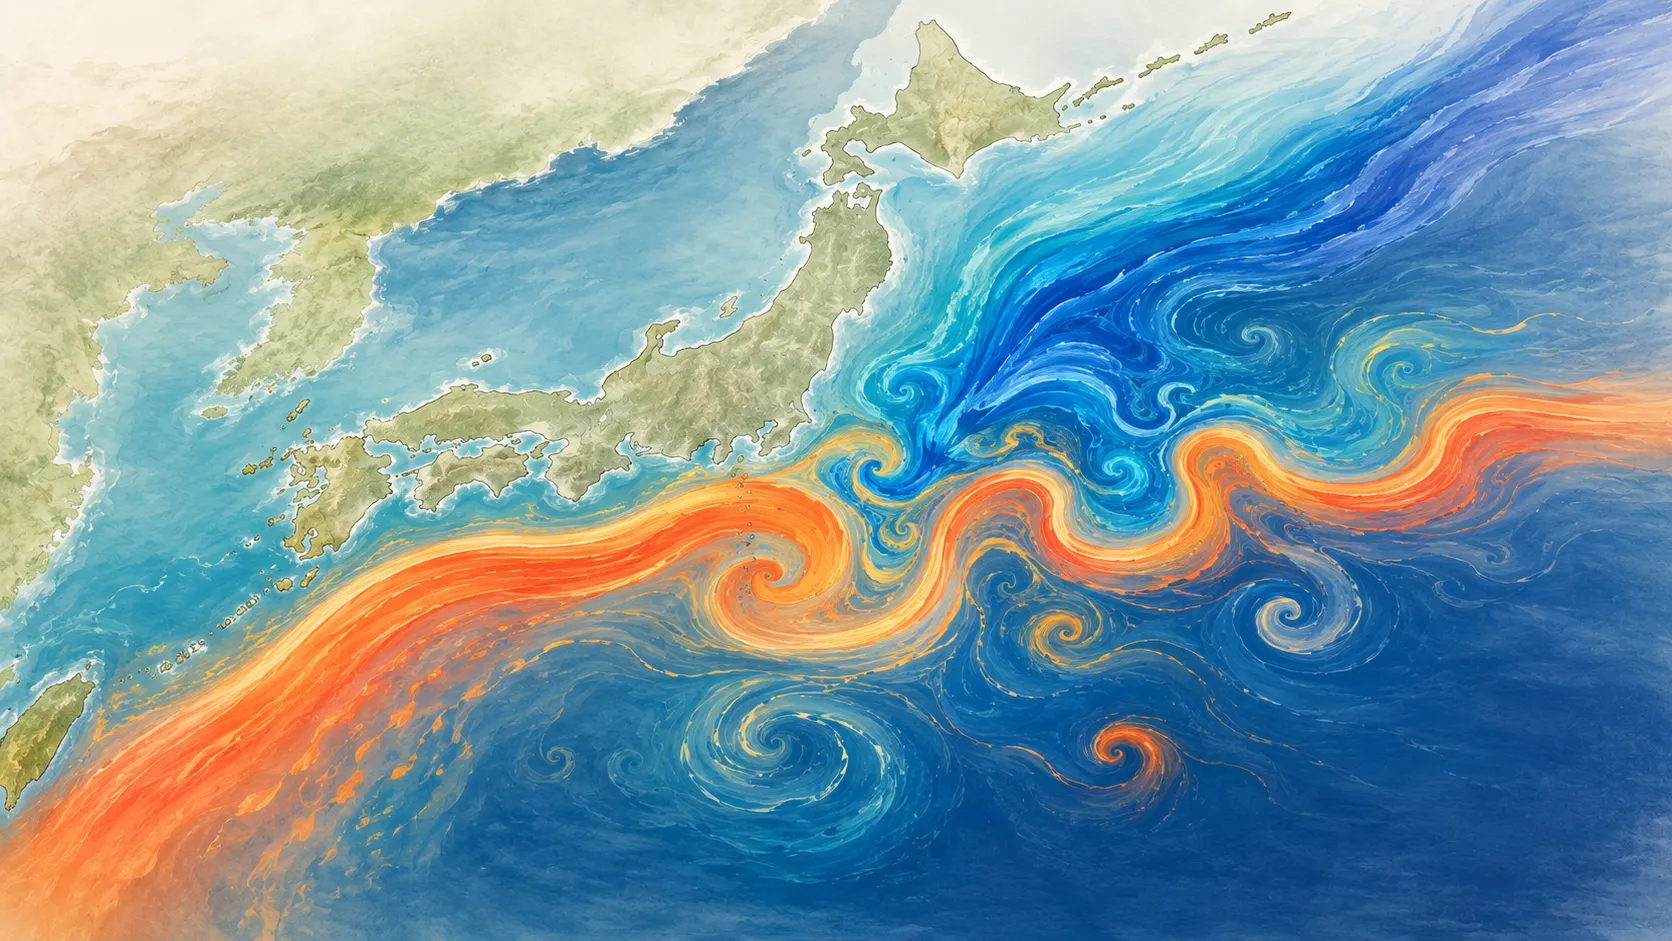
Where their influences approach each other, strong fronts, eddies, branches, and mixing occur.
For the forces that organize basin-scale circulation and produce strong western boundary currents, see What Causes Ocean Currents?.
The illustration below summarizes that moving transition east of Japan, where warm and cold waters meet through meanders and eddies.
Temperature Gives the Clearest First Contrast
Kuroshio-influenced upper water is generally warmer than Oyashio-influenced water at a similar time of year. The difference is not confined to one surface value.
Profiles can show:
- How far the warm Kuroshio-influenced layer extends downward
- Whether the Oyashio-influenced upper ocean is uniformly cold or strongly layered
- Where the strongest north-south temperature transition occurs
- Whether deeper values converge even while the upper ocean remains very different
The Japan Meteorological Agency notes that the sharp temperature change south of Japan is linked to the Kuroshio and that internal temperature and salinity structure can be used to understand the current. Its overview of temperature and salinity in the northwestern Pacific provides useful regional context.
Salinity Adds the Water’s History
The Oyashio is commonly described not only as cold but also as relatively fresh and rich in dissolved oxygen and nutrients. JMA’s Oyashio overview explains this broader water-property meaning.
Kuroshio-influenced subtropical waters often include higher-salinity layers. Rainfall, evaporation, mixing, and the presence of intermediate waters can create salinity maxima and minima at different depths.
This is why salinity profiles are valuable. They help distinguish:
- Warm water that has different freshwater histories
- A fresh subpolar influence near or below the surface
- Salty subtropical layers below the immediate surface
- Intermediate water formed through mixing and subduction east of Japan
To interpret these combinations, read How Temperature and Salinity Shape Seawater Density before assigning a water-mass name from one value.
Oxygen Can Strengthen the Contrast
Cold water can dissolve more oxygen than warm water under otherwise comparable conditions. Recently ventilated subpolar water can also carry a strong oxygen signal into the ocean interior.
That helps explain why Oyashio water is often associated with relatively high dissolved oxygen. But oxygen is not controlled by temperature alone. Air-sea exchange, biological production and respiration, circulation, and time since ventilation all contribute.
An oxygen profile should therefore be read alongside temperature and salinity. If an oxygen difference appears at the same depth as a temperature-salinity transition, that alignment is more informative than any one curve by itself.
The introductory article Where Is Oxygen Found in the Ocean? explains the typical surface, intermediate, and deep-ocean controls.
The Boundary Moves and Meanders
It is tempting to draw a permanent line between “Kuroshio water” and “Oyashio water.” The real boundary changes.
Important complications include:
- Seasonal movement of the Oyashio’s southern extent
- Kuroshio and Kuroshio Extension path variability
- Warm- and cold-core eddies
- Branches and filaments detached from the main currents
- Mixing between subtropical and subpolar water
This means latitude alone does not identify the water. Date, profile shape, nearby measurements, and sometimes a temperature-salinity diagram are all needed.
Compare Argo Profiles Across a Front
An Argo profile is a direct vertical sample of water properties at one place and time. Comparing profiles north and south of a front can reveal a strong contrast below the surface.
To examine a front’s position or movement, compare nearby profiles and measurements from different times. Differences between cycles can reflect both changes through time and changes along the float’s path.
An Argo float trajectory is also not automatically the path of the surface current. The float spends most of its cycle below the surface and can drift at a configured depth before profiling.
Compare the Two Regions Carefully
A useful OceanGraph comparison is:
- Choose one limited month and year.
- Search a region south or southeast of Japan for Kuroshio-influenced profiles.
- Search farther northeast for Oyashio-influenced profiles using a comparable date range.
- Compare temperature first, then salinity.
- If available, compare dissolved oxygen.
- Use a θ-S view to examine the property combinations rather than relying on latitude alone.
The date should be held as consistent as possible because the upper ocean changes seasonally. The Search and Bookmark guide explains geographic and date filtering. For the profile-reading sequence, use Ocean Temperature and Salinity Profiles Explained and then T-S Diagrams in Oceanography Explained.