On this page
Oxygen is present throughout much of the ocean, but its concentration does not decrease in one simple line from the surface to the seafloor. It is often high near the surface, lower at intermediate depths where respiration consumes oxygen and ventilation is weak, and higher again in some deep waters that formed in cold, well-ventilated regions.
The exact shape varies greatly between ocean basins. A dissolved oxygen profile shows that vertical structure directly.
Why Oxygen Is Often High Near the Surface
The atmosphere and ocean exchange gases at the sea surface. Wind and waves help mix that oxygen into the upper layer.
Oxygen near the surface is also affected by:
- Solubility: colder water can hold more dissolved oxygen than warmer water under comparable conditions
- Photosynthesis: phytoplankton and other photosynthetic organisms produce oxygen in the sunlit layer
- Respiration: organisms consume oxygen throughout the water column
- Mixing: turbulence can carry oxygen-rich surface water downward
Why Oxygen Often Decreases Below the Sunlit Layer
Organic matter produced near the surface sinks and is decomposed by organisms. That respiration consumes oxygen.
Particle Backscattering and bbp700 explains how optical measurements help locate particle-rich layers and why particle concentration alone does not measure the downward flux of organic carbon.
What Is Ocean Acidification? explains how to compare pH with oxygen and distinguish differences with depth from long-term changes.
Remineralization also returns nitrogen to inorganic forms, but circulation and microbial nitrogen loss can alter the relationship, so nitrate and oxygen do not always change in opposite directions. How Does Nitrate Change With Depth? Reading BGC Argo Profiles explains nitrate’s vertical distribution and how to compare it with oxygen.
At the same time, water below the surface may exchange oxygen with the atmosphere only slowly. Where consumption is strong and ventilation is weak, an oxygen minimum zone can form at intermediate depth.
The Japan Meteorological Agency’s overview of dissolved oxygen in the ocean shows a common Pacific pattern: oxygen decreases below the surface, reaches an intermediate minimum, and then can increase again in deeper water. NOAA gives a complementary explanation of oxygen minimum zones.
Not every basin follows the same depth range or minimum concentration. Eastern tropical oceans, the Arabian Sea, the western North Pacific, enclosed seas, and polar waters can look very different.
How Deep Water Receives Oxygen
Deep water does not obtain oxygen from sunlight. It receives oxygen when surface water is ventilated, becomes dense enough to sink, and then spreads through the ocean interior.
Cold high-latitude water can begin with relatively high oxygen solubility. Once it leaves the surface, its oxygen concentration changes as it mixes and as respiration continues. Oxygen therefore carries information about both biological consumption and the circulation history of the water.
The illustration below brings together oxygen supplied near the surface, consumption at intermediate depth, and transport into deep water.

A Local Maximum Can Appear Below the Surface
Some profiles contain a subsurface oxygen maximum: a local peak below the immediate surface layer.
Possible contributors include:
- Photosynthetic production below the very surface
- Ventilation and subduction of oxygen-rich water
- Advection of a different water mass
- The background effect of temperature on solubility
- Mixing between layers
A concentration profile alone cannot separate these mechanisms. The feature should be checked against temperature, salinity, mixed layer depth, nearby profiles, and data quality.
Read Oxygen With Temperature and Salinity
An oxygen curve becomes more meaningful when it is aligned with physical structure.
Ask:
- Does the oxygen change occur above or below the mixed layer?
- Does it align with a thermocline or salinity transition?
- Are two oxygen profiles actually sampling different water masses?
- Is the feature present in adjacent cycles?
The Ocean Temperature and Salinity Profiles Explained guide provides the physical foundation. For a detailed BGC interpretation, continue with Dissolved Oxygen Profiles in BGC Argo Explained.
Concentration Is Not the Same as Saturation
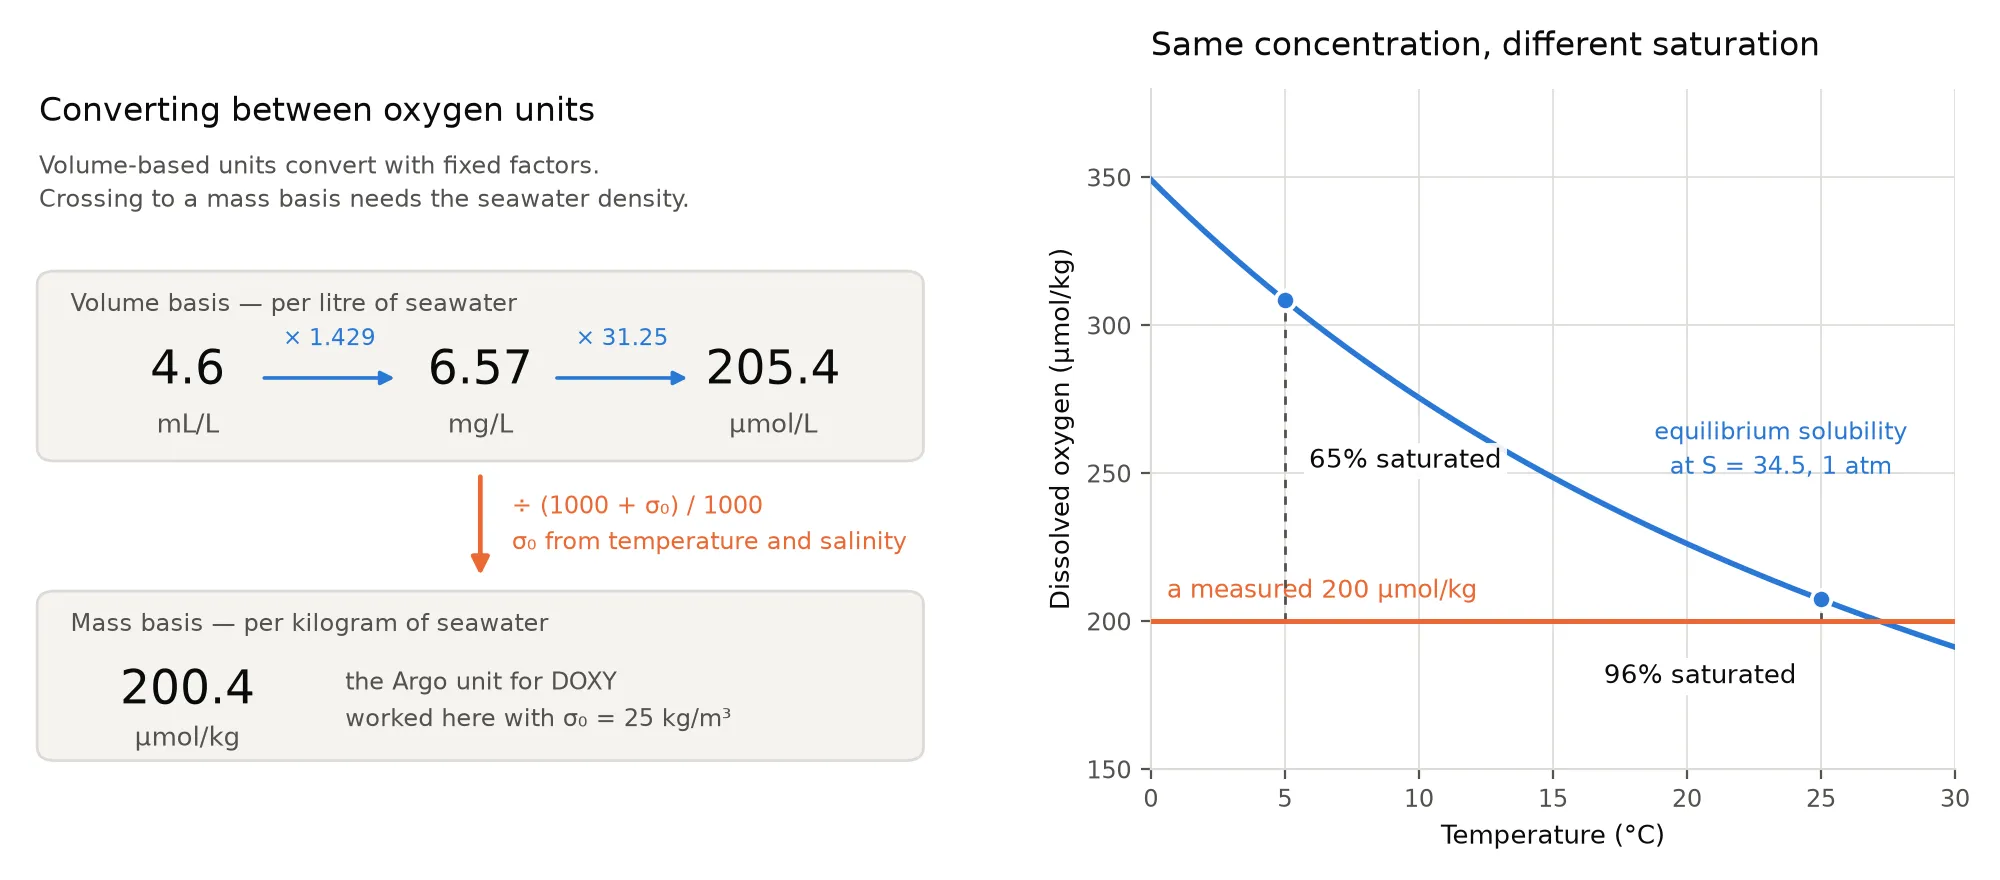
Oxygen concentration is the amount dissolved in the water. Oxygen saturation is the ratio of the measured concentration to an equilibrium concentration. In oceanography, the reference is usually equilibrium with air at one atmosphere, for the water’s temperature and salinity. The GSW oxygen-solubility function uses this reference condition.
Cold water may contain more oxygen than warm water partly because its solubility is higher. Comparing concentration alone can therefore mix together:
- Physical solubility
- Air-sea exchange
- Biological production and consumption
- Transport and mixing
Dissolved Oxygen Units in Ocean Data covers the distinction between saturation and concentration, along with conversions between µmol/kg, mL/L, and mg/L.
Not Every Argo Float Measures Oxygen
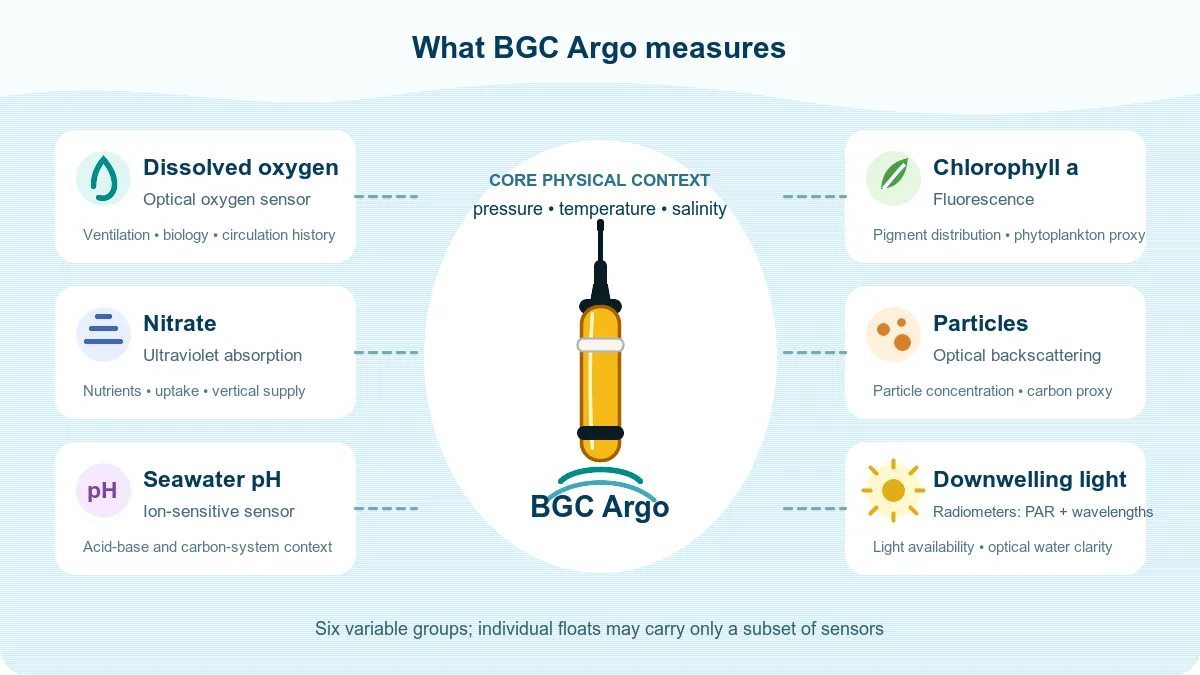
Core Argo floats primarily measure pressure, temperature, and salinity. Dissolved oxygen is available from a subset of floats with biogeochemical sensors.
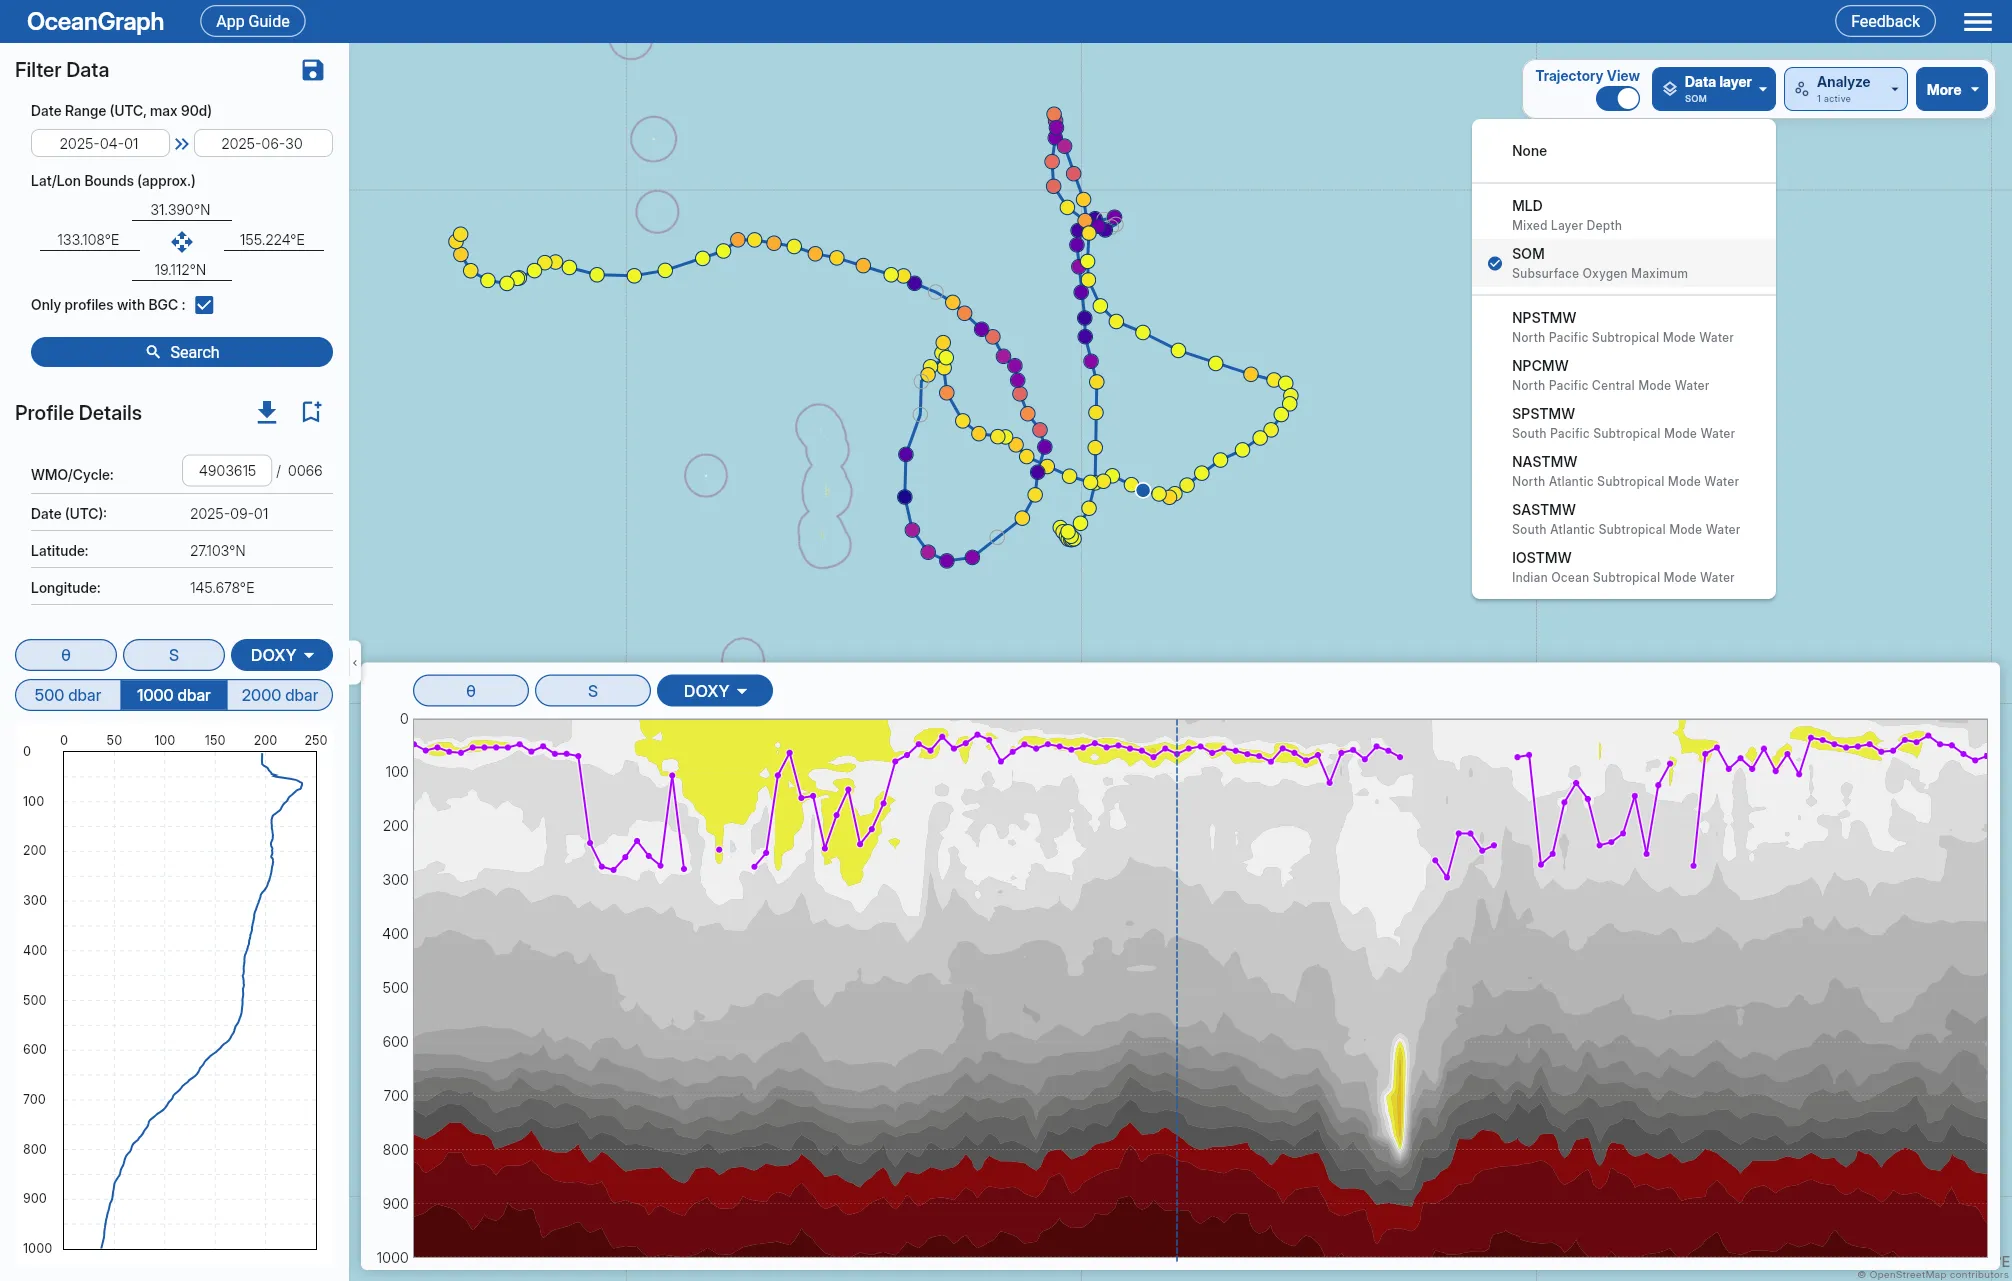
OceanGraph’s Only profiles with BGC filter narrows the search to profiles containing at least one supported BGC variable. It is not an oxygen-only filter, so the selected profile still needs to be checked for dissolved oxygen.
The Search and Bookmark guide documents the filter. The Subsurface Oxygen Maximum guide explains OceanGraph’s derived SOM indicator and its limits.
Explore an Oxygen Profile Carefully
A practical reading order is:
- Confirm the profile date, location, WMO ID, and cycle number.
- Confirm that dissolved oxygen is available.
- Read temperature and salinity first.
- Follow the oxygen curve from the surface downward.
- Look for a local maximum, an intermediate decline, or a deeper increase.
- Compare nearby cycles and inspect gaps before assigning a mechanism.
Missing values are not zero oxygen. Sensor availability, quality control, and data mode all affect what remains in a profile. For scientific use, Argo Data Quality Control explains why adjusted values and QC context matter.