On this page
BGC Argo extends the physical view from Core Argo with sensors for oxygen, nutrients, carbon-system chemistry, plankton pigments, particles, and light. These measurements help researchers ask how ocean circulation, biology, and chemistry interact below the surface.
If Argo itself is new to you, begin with What Is an Argo Float? A Complete Guide to Ocean Observation Data.
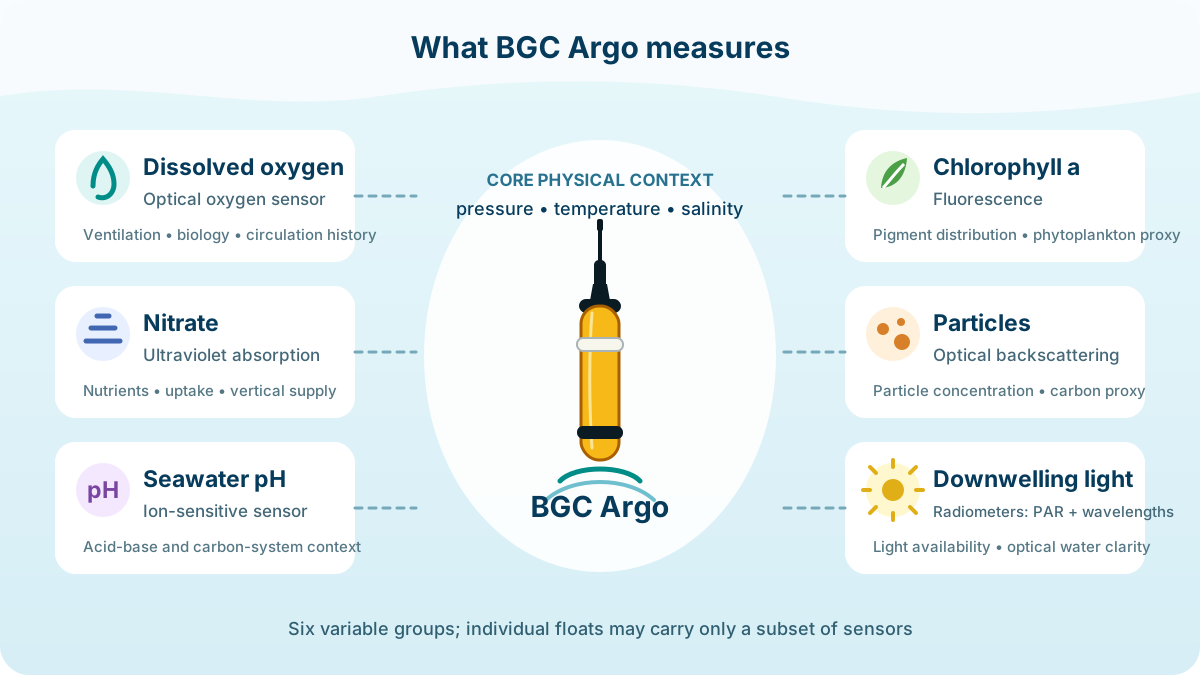
Core Argo and BGC Argo Answer Different Questions
Core Argo profiles pressure, temperature, and salinity. From those measurements, researchers can examine the ocean’s physical structure, including stratification, mixed layers, and water masses.
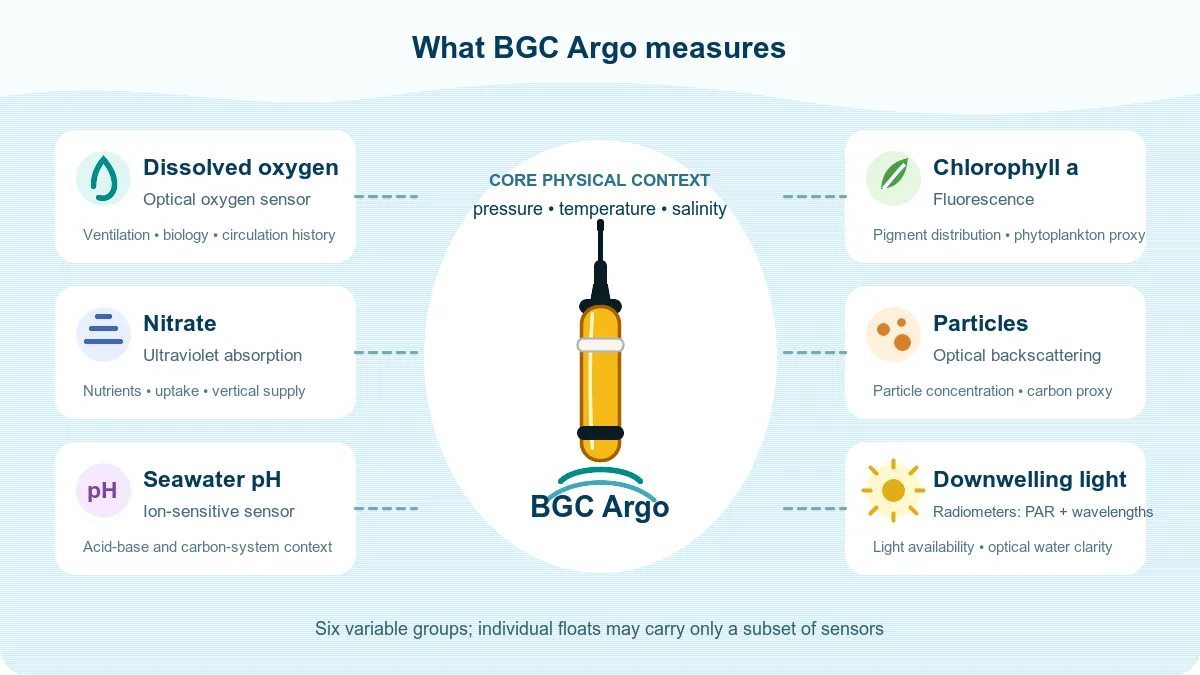
BGC Argo floats add one or more biogeochemical and optical sensors. The international program organizes their observations into six broad groups:
- Dissolved oxygen
- Nitrate
- pH
- Chlorophyll a
- Suspended particles
- Downwelling irradiance
Temperature and salinity shape gas solubility, density, mixing, and nutrient supply. BGC variables are therefore usually most informative when the physical profiles remain visible beside them.
The Six BGC Argo Variable Groups
| Variable group | Typical sensing approach | What the profile helps you examine |
|---|---|---|
| Dissolved oxygen | Optical oxygen sensor, often called an optode | Ventilation, air-sea exchange, biological production and consumption, and water-mass history |
| Nitrate | Ultraviolet absorption | The vertical distribution of an important nutrient and changes associated with uptake, remineralization, and transport |
| pH | Ion-sensitive solid-state sensor | Ocean acid-base conditions and part of the marine carbon-system context |
| Chlorophyll a | Fluorescence | The vertical distribution of a photosynthetic pigment used as a proxy for phytoplankton abundance |
| Suspended particles | Optical backscattering | Changes in particle concentration and a proxy for particulate organic matter or phytoplankton carbon |
| Downwelling irradiance | Radiometers measuring light at selected wavelengths or over the photosynthetically active range | How usable light decreases with depth and changes with water clarity, particles, and the time of observation |
Dissolved oxygen
Oxygen often provides the most intuitive bridge from physical to biogeochemical profiles. It responds to atmospheric exchange, solubility, photosynthesis, respiration, mixing, and circulation history.
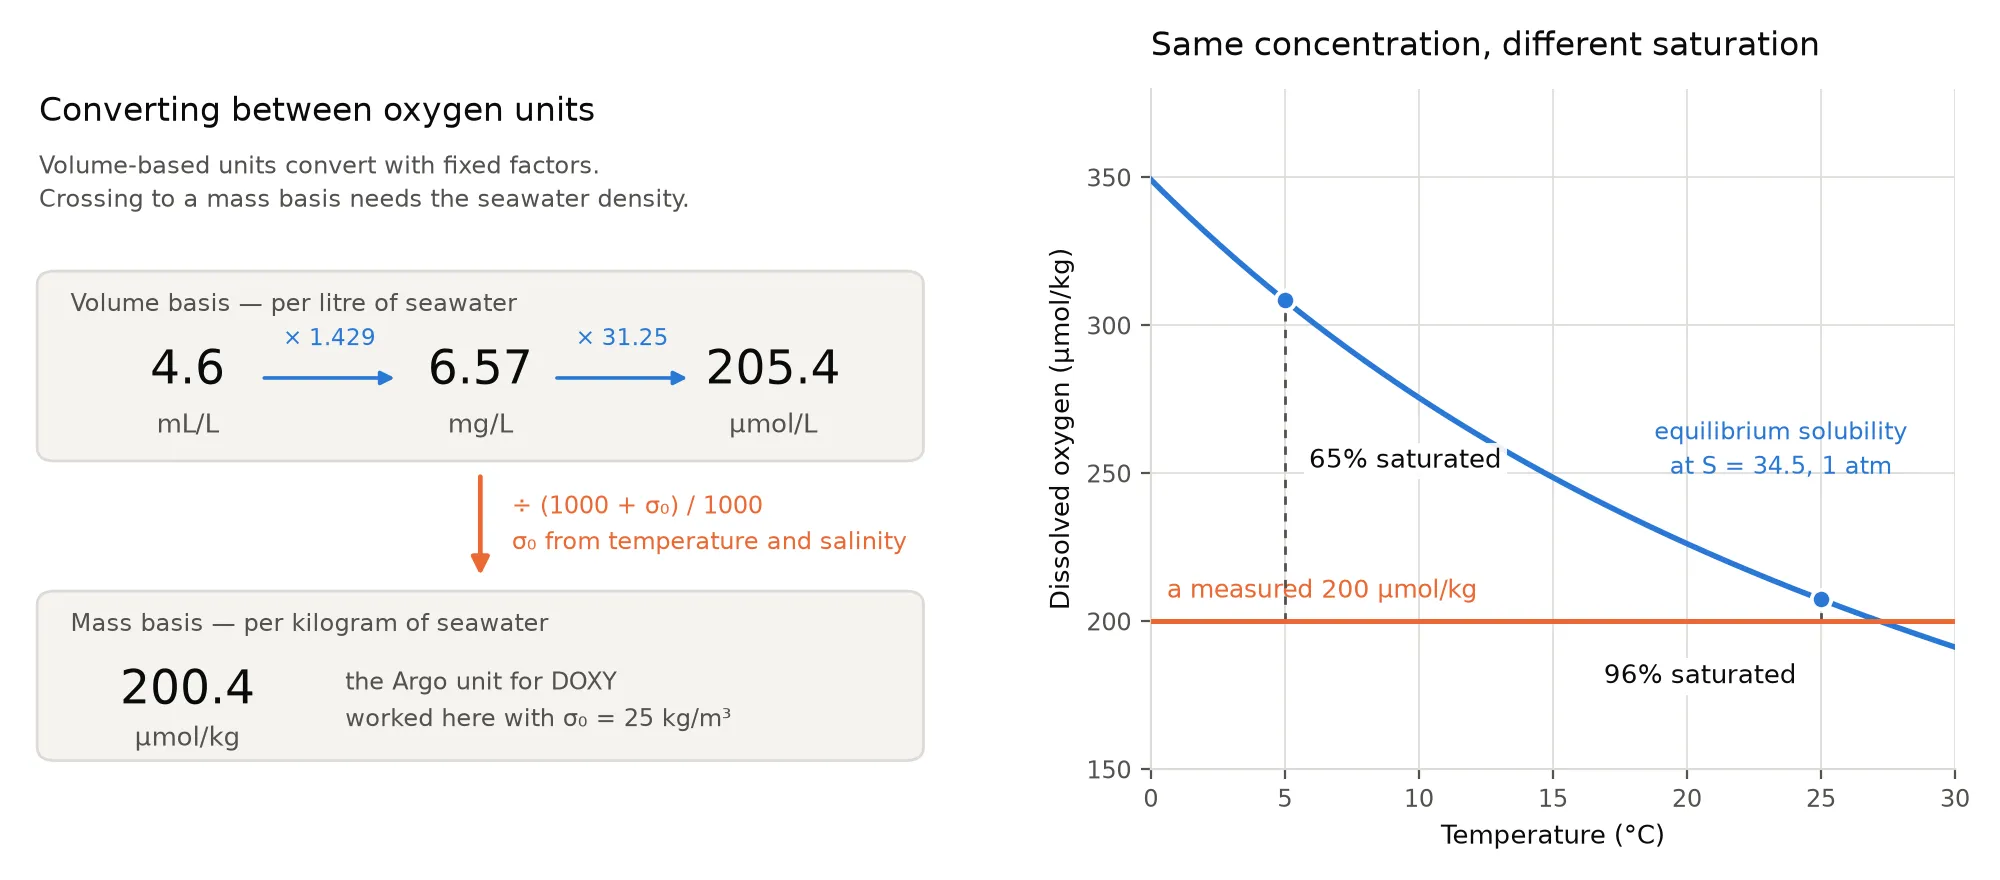
Read Dissolved Oxygen Profiles in BGC Argo Explained for profile shapes, then use Dissolved Oxygen Units in Ocean Data when comparing concentrations reported on a volume or mass basis.
Nitrate
Nitrate is a major nutrient for phytoplankton. Its profile can show nutrient-poor surface water above richer subsurface water, but the shape depends on uptake, remineralization, vertical transport, and water-mass history.
Compare the nitrate profile with light, chlorophyll, temperature, and salinity to examine the processes involved.
pH
Seawater pH is one part of the marine carbonate system. A pH profile adds information about acid-base conditions, but pH alone does not provide every carbon-system variable.
Small numerical differences can be meaningful, so the scale, calibration, adjusted data, and quality flags matter.
Chlorophyll a
BGC floats generally estimate chlorophyll a from fluorescence. This is especially valuable because satellite ocean color mainly describes the near-surface ocean, while a float records a vertical profile.
Fluorescence is a useful pigment proxy, not a direct count of phytoplankton cells, carbon biomass, or photosynthetic rate. The relationship changes with community composition, physiology, light history, and sensor processing. See How Does Chlorophyll Change With Depth? for a profile-reading workflow.
Suspended particles and backscattering
Optical backscattering measures light scattered back toward a sensor by particles. OceanGraph exposes the particulate backscattering coefficient at 700 nm as bbp700.
Backscattering is commonly used as a particle or phytoplankton-carbon proxy. It is particularly useful beside chlorophyll: if chlorophyll rises without a similar backscattering feature, photoacclimation may be part of the explanation.
Particle Backscattering and bbp700 explains the measurement, its units, and how to distinguish broad particle layers from individual spikes in a profile.
Downwelling irradiance and PAR
Downwelling irradiance describes light traveling downward through the water. Some sensors target specific wavelengths; photosynthetically active radiation, or PAR, integrates the band of light commonly used in photosynthesis.
Light fields vary with depth, time of day, clouds, sun angle, water clarity, and particles. A single profile is therefore a snapshot of both the water column and the illumination at observation time.
Why OceanGraph Shows Seven BGC Fields
The six international groups are conceptual categories. OceanGraph currently carries seven named BGC fields:
- Oxygen
- Chlorophyll
- Nitrate
- Particulate backscattering at 700 nm, or bbp700
- pH on the total scale in situ
- Downwelling irradiance at 490 nm
- Photosynthetically active radiation, or PAR
The final two fields both belong to the downwelling-irradiance group. That is why seven data fields still correspond to six BGC variable groups.
OceanGraph provides charts for oxygen, chlorophyll, nitrate, bbp700, pH, and PAR. Downwelling irradiance at 490 nm is available in search and download data.
Not Every BGC Float Measures Everything
A BGC float may carry only a subset of the sensor package. Sensors can also begin or stop reporting at different points in a float’s life. Consequently:
- A BGC search result does not guarantee a chlorophyll or nitrate profile
- One cycle can contain a variable that is absent in another cycle
- Usable depth coverage may differ by variable
- Quality-control and adjusted-data status can differ within the same profile
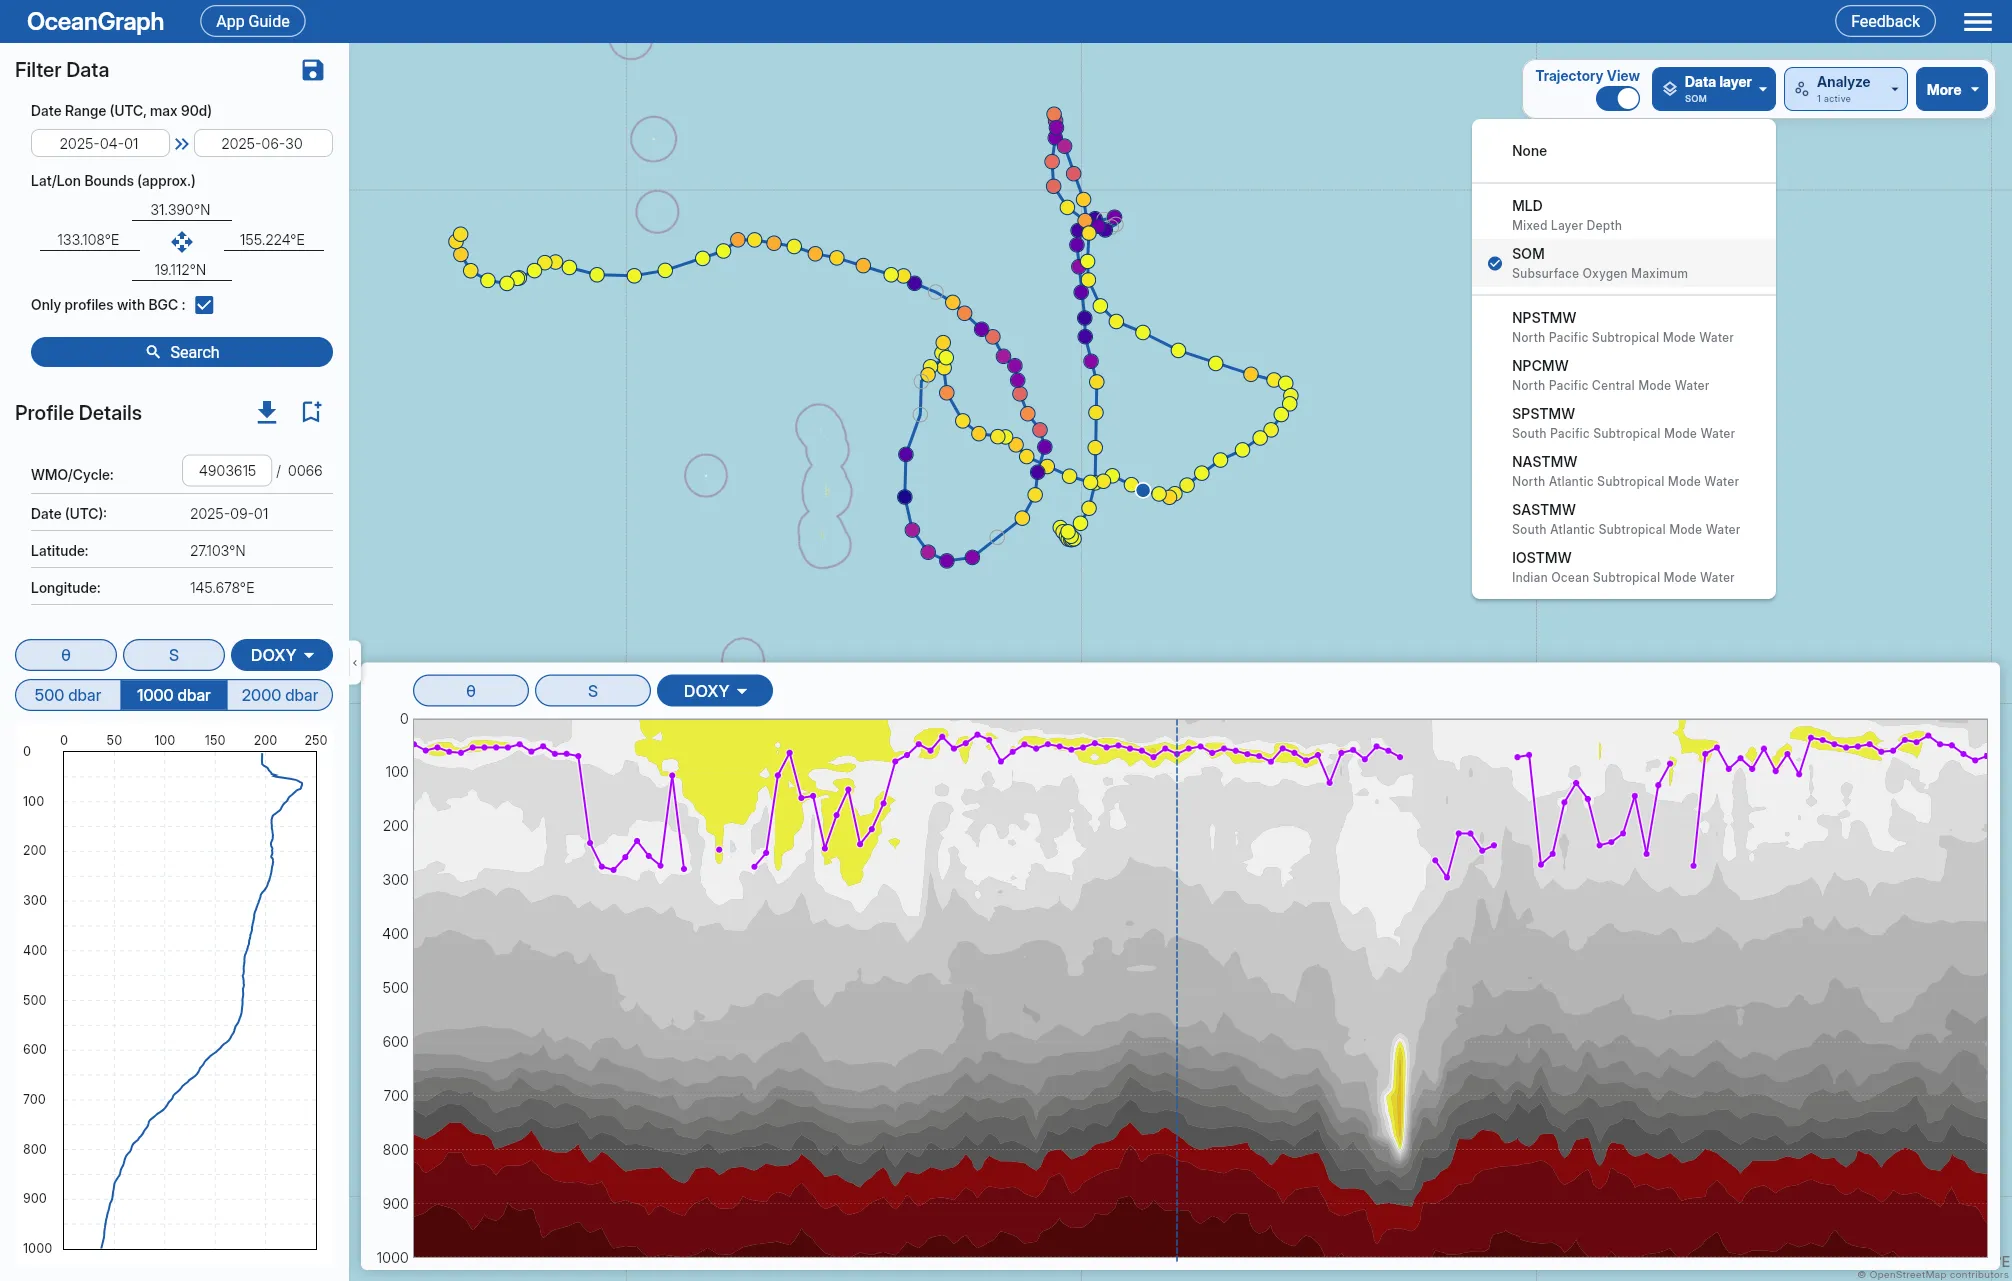
In OceanGraph, Only profiles with BGC means that at least one supported BGC value is present. Confirm the individual fields after opening the profile or downloading its data.
The Argo Data Management documentation publishes general BGC quality-control procedures and variable-specific manuals. Those sources should guide analysis that goes beyond an exploratory browser view.
A Practical Reading Sequence
Use the same order each time until it becomes habitual.
- Identify the float, cycle, location, date, and available variables.
- Read temperature and salinity first. Look for mixed layers, thermoclines, haloclines, and water-mass changes.
- Inspect one BGC variable at a time. Note maxima, minima, gradients, gaps, and the pressure range actually observed.
- Compare related variables. Chlorophyll with bbp700 and light; nitrate with chlorophyll and light; oxygen with temperature and salinity.
- Check neighboring cycles. A repeated feature is easier to interpret than an isolated spike.
- Review quality and processing metadata before quantitative use. Prefer adjusted values when the Argo record provides them and keep missing observations distinct from measured zeros.
The Search and Bookmark guide explains how to find profiles with BGC data. The Analysis Lab vertical-profile guide shows how to compare exported JSON profiles.
For a broader search workflow, see Finding Argo Float Profiles by Location, Time, and WMO ID.