On this page
Chlorophyll is not always most concentrated at the sea surface. In stratified waters, a BGC Argo profile may show a distinct peak tens or even more than one hundred meters below it. Oceanographers call this a deep chlorophyll maximum, or DCM; the same feature is also called a subsurface chlorophyll maximum, or SCM.
A DCM can reflect more phytoplankton biomass at depth, more chlorophyll pigment inside cells adapted to low light, or a mixture of both. Chlorophyll alone cannot distinguish those cases.
For the larger sensor picture, first read What Does BGC Argo Measure?.
What a BGC Argo Chlorophyll Profile Measures
BGC Argo floats estimate chlorophyll a with a fluorometer. The sensor emits light and records fluorescence from chlorophyll molecules. The reported profile is therefore a fluorescence-derived estimate, commonly expressed in milligrams per cubic meter.
Chlorophyll a is the main photosynthetic pigment used by many marine phytoplankton, so the measurement is a valuable indicator of their vertical distribution. It is not a direct measurement of:
- Cell abundance
- Phytoplankton carbon biomass
- Species composition
- Photosynthetic or primary-production rate
The chlorophyll-to-carbon relationship changes as cells adjust their pigment content, and fluorescence itself is influenced by physiology, community composition, light exposure, calibration, and data processing. The BGC Argo chlorophyll overview describes these measurement principles and limitations.
Common Chlorophyll Profile Shapes
There is no universal chlorophyll profile. Three broad shapes provide a useful vocabulary for describing what you see.
Surface-intensified chlorophyll
Chlorophyll is greatest near the surface and decreases downward. This can occur when phytoplankton and suitable growth conditions are concentrated in a well-lit upper layer.
Do not assume every near-surface decrease is biological. Daytime fluorescence close to the surface can be suppressed by non-photochemical quenching, a protective response to strong light. The apparent surface value may then be lower than the chlorophyll concentration alone would suggest.
A deep chlorophyll maximum
The profile has a local maximum below the near-surface layer. DCM depth and strength vary among regions, seasons, and water-column states. It is not defined by one universal pressure threshold.
The peak often appears where the remaining light, upward nutrient supply, stratification, and phytoplankton physiology create favorable conditions for accumulating pigment.
Weak, broad, or irregular structure
Some profiles have no sharp maximum. Chlorophyll may be low throughout the observed range, spread across a broad layer, interrupted by missing observations, or shaped by several small features.
A smooth-looking curve should not be invented across data gaps. Confirm which pressures contain measurements before describing a layer.
Why a Deep Chlorophyll Maximum Forms
The upper ocean presents a vertical tradeoff. Light generally decreases with depth, while nutrients depleted near the surface can increase below the sunlit layer. Mixing and stratification control how readily those nutrients reach illuminated water.
A subsurface chlorophyll peak can emerge near the depth where these constraints balance. Its formation may involve:
- Phytoplankton growth or accumulation at depth
- Increased chlorophyll per cell as phytoplankton acclimate to lower light
- Vertical changes in nutrient availability
- Mixing, sinking, buoyancy regulation, and horizontal transport
- Changes in phytoplankton community composition
The balance changes over a seasonal cycle and differs among ocean regions. A DCM should therefore be treated as an observed vertical feature first and a process diagnosis second.
Deep Photoacclimation Maximum or Deep Biomass Maximum?
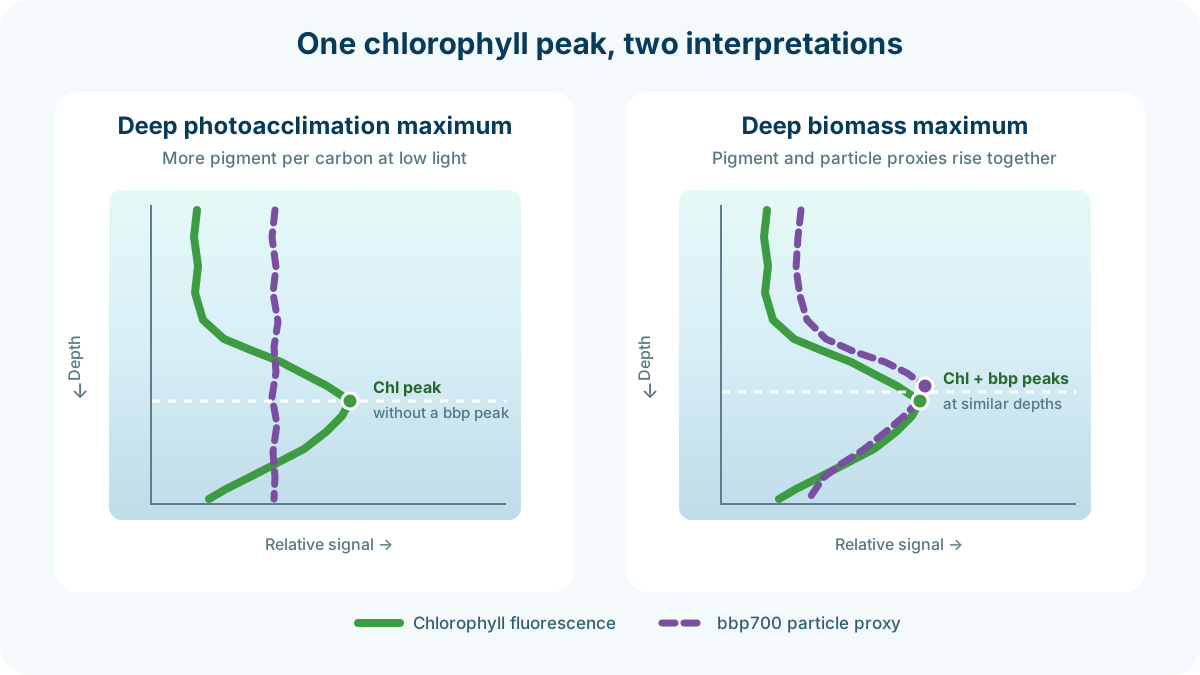
The most important interpretive distinction is whether the chlorophyll peak represents pigment packaging or a genuine concentration of particulate biomass.
Researchers often describe two end members:
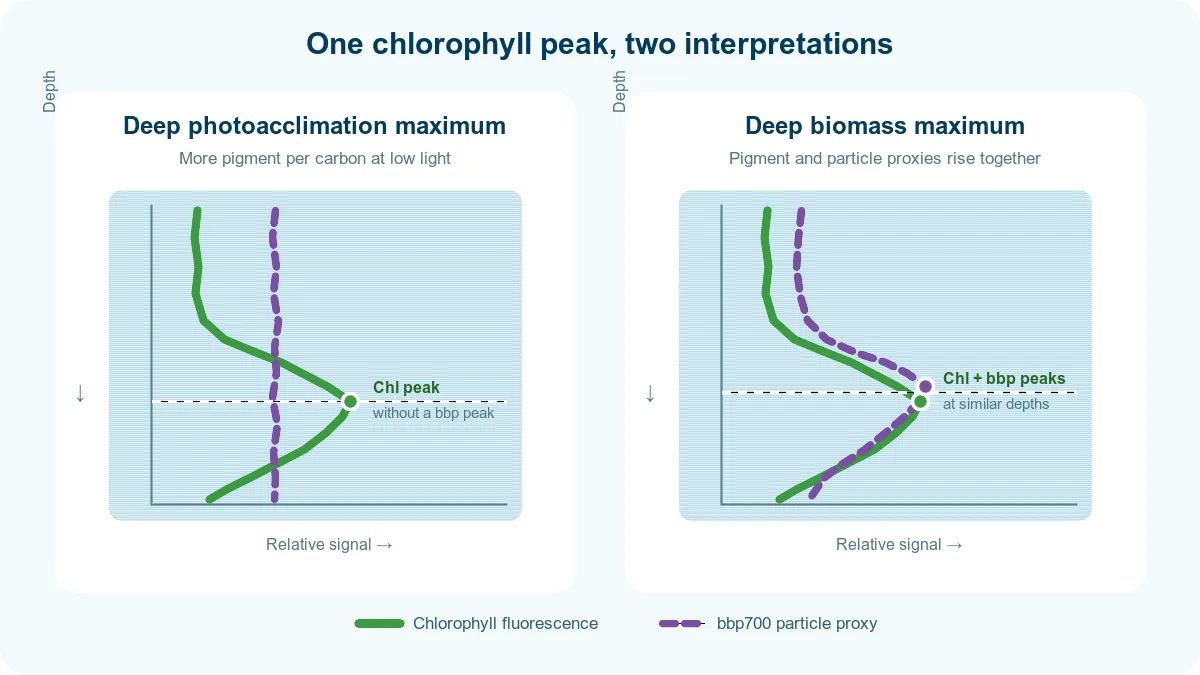
- Deep photoacclimation maximum: cells contain more chlorophyll relative to carbon in dim light, producing a fluorescence peak without a comparable biomass peak.
- Deep biomass maximum: phytoplankton carbon or particle concentration also peaks near the chlorophyll maximum.
The ocean can fall between these end members. A study using BGC Argo observations distinguished them by combining chlorophyll with particulate backscattering rather than treating fluorescence alone as biomass (Cornec et al., 2021).
Use bbp700 as a second optical clue
OceanGraph carries the particulate backscattering coefficient at 700 nm, or bbp700, when the float provides it. Backscattering is often used as a particle or phytoplankton-carbon proxy.
Compare the profiles cautiously:
- A chlorophyll peak with little corresponding bbp700 increase is consistent with stronger photoacclimation.
- Chlorophyll and bbp700 peaks at similar depths are more consistent with a biomass maximum.
- Disagreement in depth or shape may indicate mixed processes, particle types, sensor effects, or mismatched valid coverage.
bbp700 includes particles other than living phytoplankton and needs its own quality checks.
Add Light, Nutrients, and Physical Structure
A stronger DCM interpretation uses several profiles together.
PAR or downwelling irradiance
Light profiles show how quickly illumination decreases through the water column. A chlorophyll maximum just above very low-light water has a different context from one inside a relatively bright mixed layer.
Time of day, clouds, sun angle, particles, and sensor availability all affect a single light profile. Read it as the light conditions at the time of observation.
Nitrate
Nitrate can show where nutrient-poor upper water transitions toward nutrient-richer subsurface water. A DCM near that transition is physically plausible, but co-location alone does not prove nutrient limitation or a particular flux.
Temperature and salinity
Temperature and salinity reveal mixed layers, stratification, and water-mass changes. A chlorophyll feature at a sharp physical boundary may be related to vertical stability or transport rather than only to local growth.
For help reading those physical profiles, see Ocean Temperature and Salinity Profiles Explained.
How to Inspect Chlorophyll Profiles in OceanGraph
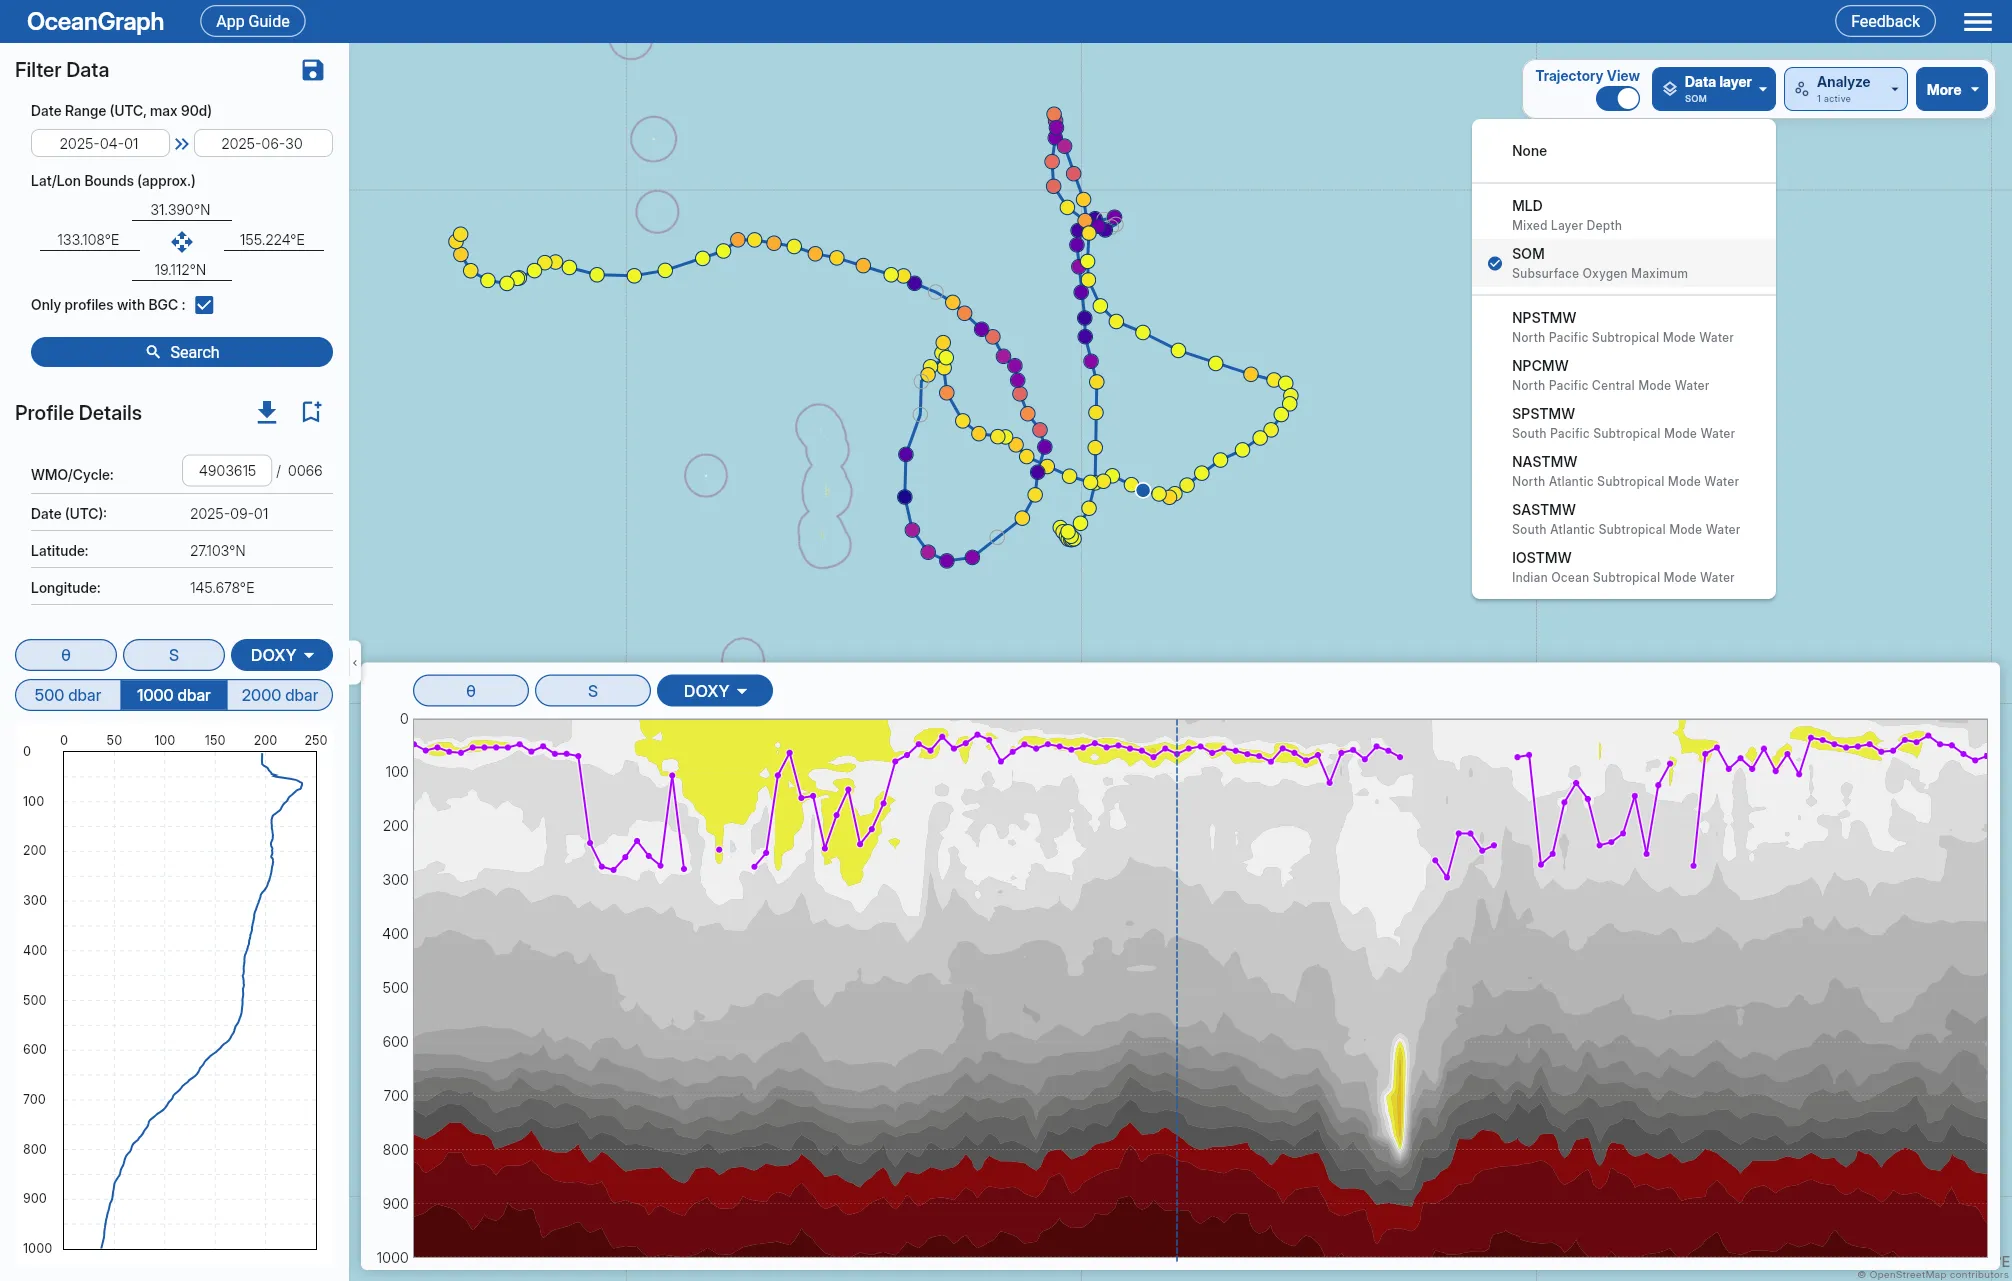
- Search a region and time range where BGC floats are present.
- Enable Only profiles with BGC to narrow the result set.
- Open a profile and confirm that chlorophyll is actually available; the BGC filter is not chlorophyll-specific.
- Plot chlorophyll and note the pressure, width, and strength of any subsurface maximum.
- Compare bbp700, nitrate, PAR, temperature, and salinity where available.
- Move through neighboring cycles to see whether the feature persists, deepens, shoals, or disappears.
Use the Search and Bookmark guide for profile discovery and the Analysis Lab vertical-profile guide to compare downloaded JSON profiles.
The broader workflow in Finding Argo Float Profiles by Location, Time, and WMO ID is useful when you need to separate one float’s seasonal evolution from a regional snapshot.
A Careful Way to Report a DCM
Separate description from interpretation. For example:
The fluorescence-derived chlorophyll profile has a subsurface maximum near 80 dbar. bbp700 does not show a similarly strong peak, so photoacclimation is one plausible contributor.
Further Reading
- BGC Argo: Chlorophyll a
- Cornec et al. (2021): Deep Chlorophyll Maxima in the Global Ocean
- Mignot et al. (2014): Understanding the seasonal dynamics of phytoplankton biomass and the deep chlorophyll maximum in oligotrophic environments
- Argo Data Management documentation and chlorophyll quality-control manuals