On this page
When people move beyond temperature and salinity, dissolved oxygen is often the first biogeochemical variable they want to understand. That makes sense. Oxygen adds information about ventilation, near-surface exchange, biological production and respiration, and water-mass history that temperature alone cannot provide.
If you are completely new to Argo itself, start with What is Argo Float? A Complete Guide to Ocean Observation Data.
If your first question is where oxygen is usually high or low in the water column, read Where Is Oxygen Found in the Ocean? before the BGC-specific workflow.
Why Dissolved Oxygen Matters
Dissolved oxygen is useful because it reflects more than one process.
Depending on the region and depth, oxygen structure can be influenced by:
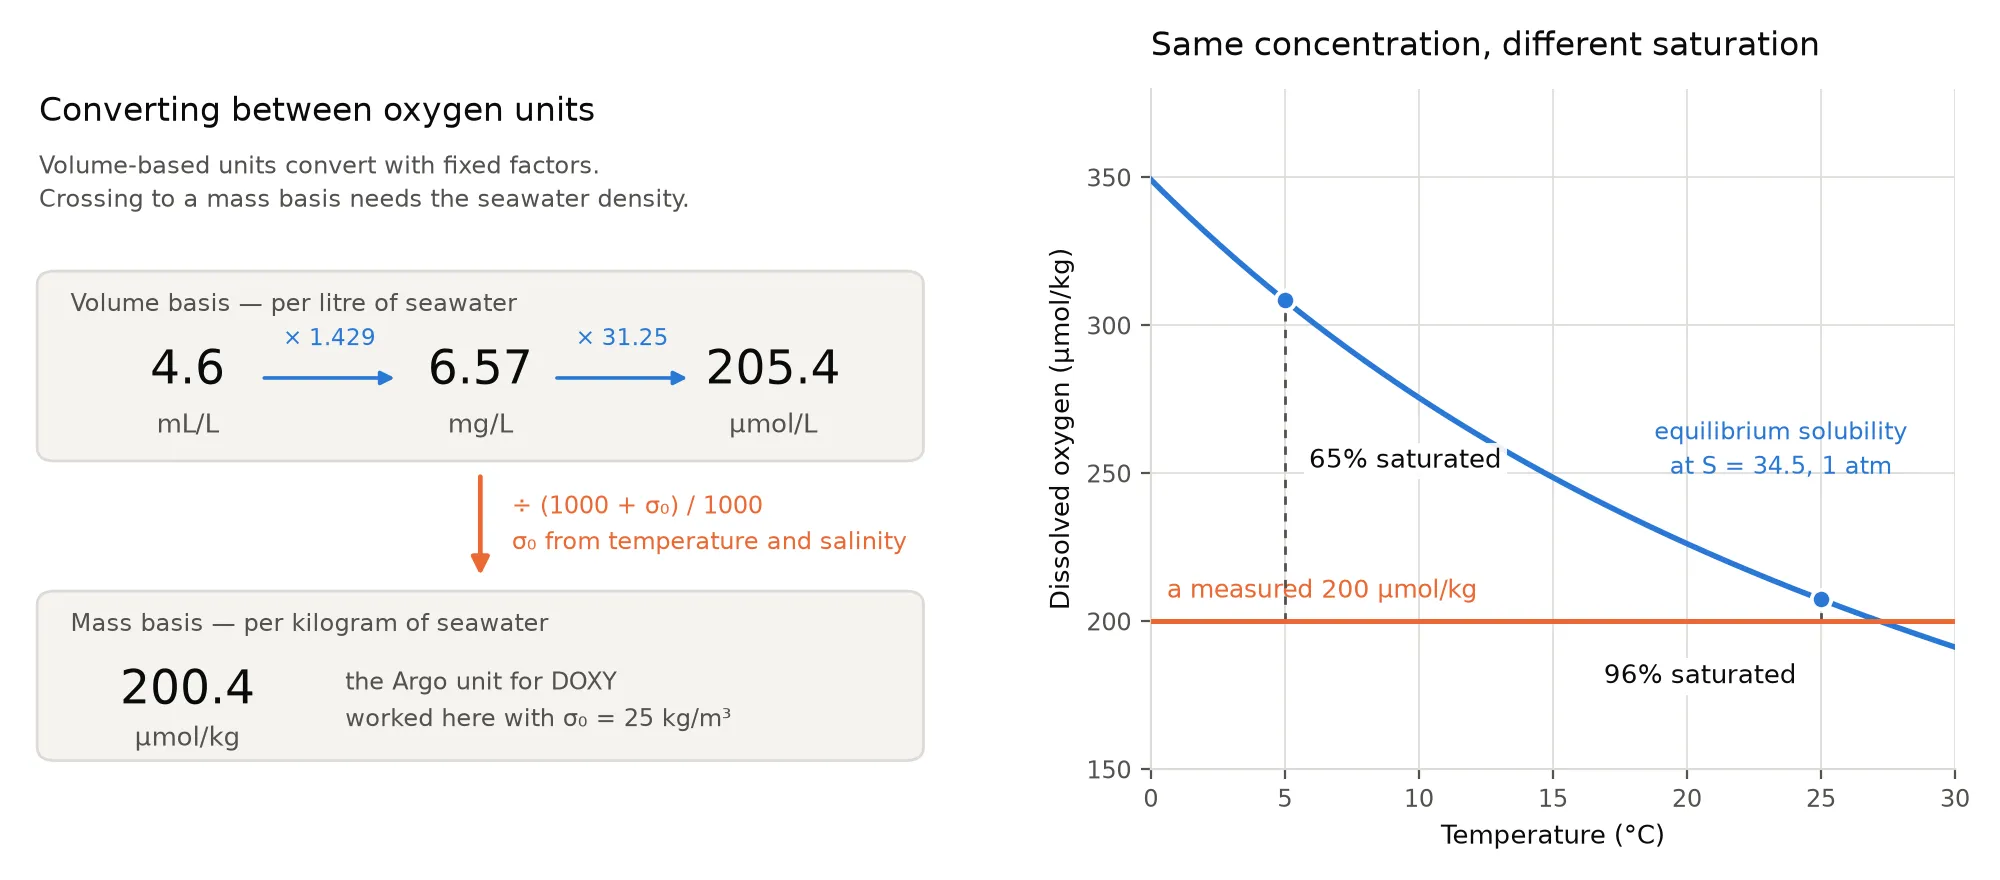
- Air-sea gas exchange and oxygen solubility, which varies with temperature and salinity
- Photosynthetic production and respiratory or remineralization consumption
- Ventilation, mixing, and advection
- Stratification that isolates subsurface water
- The circulation history and time since a water mass was last ventilated
An oxygen profile can help distinguish waters with similar temperatures but different recent histories.
This is also why oxygen is best interpreted alongside Ocean Temperature and Salinity Profiles Explained, not in isolation.
What BGC Argo Adds to Core Argo
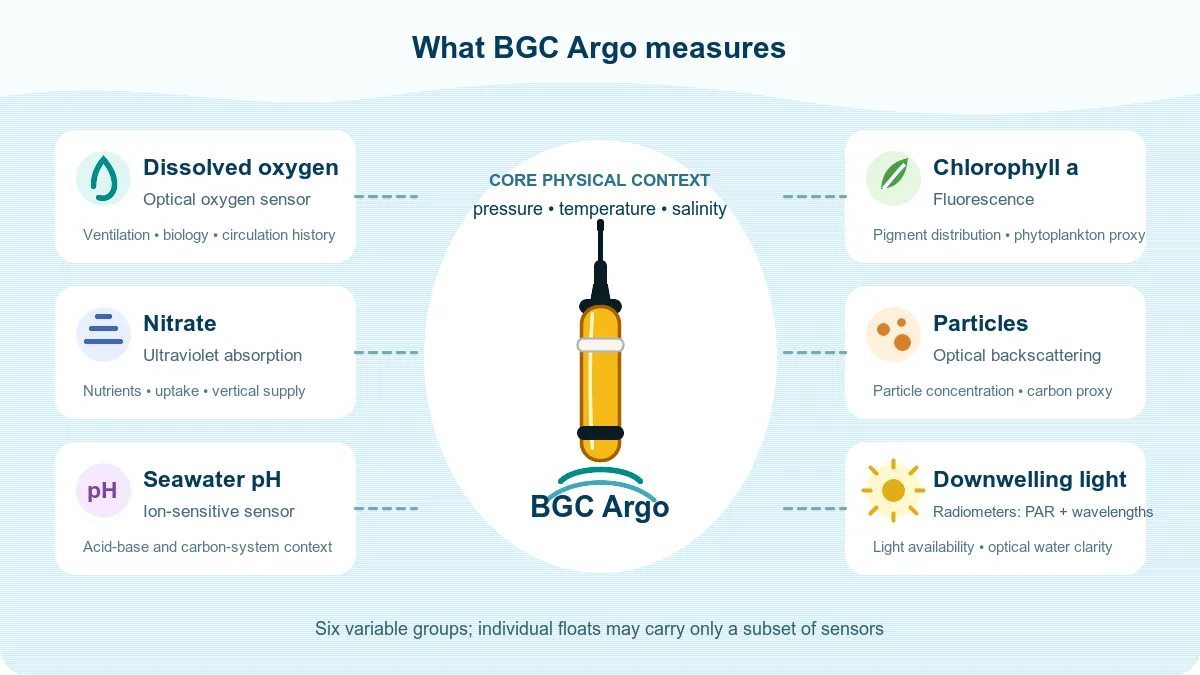
Core Argo focuses on the main physical structure of the ocean, especially temperature and salinity. BGC Argo is the subset of the Argo system that carries additional biogeochemical sensors, including dissolved oxygen.
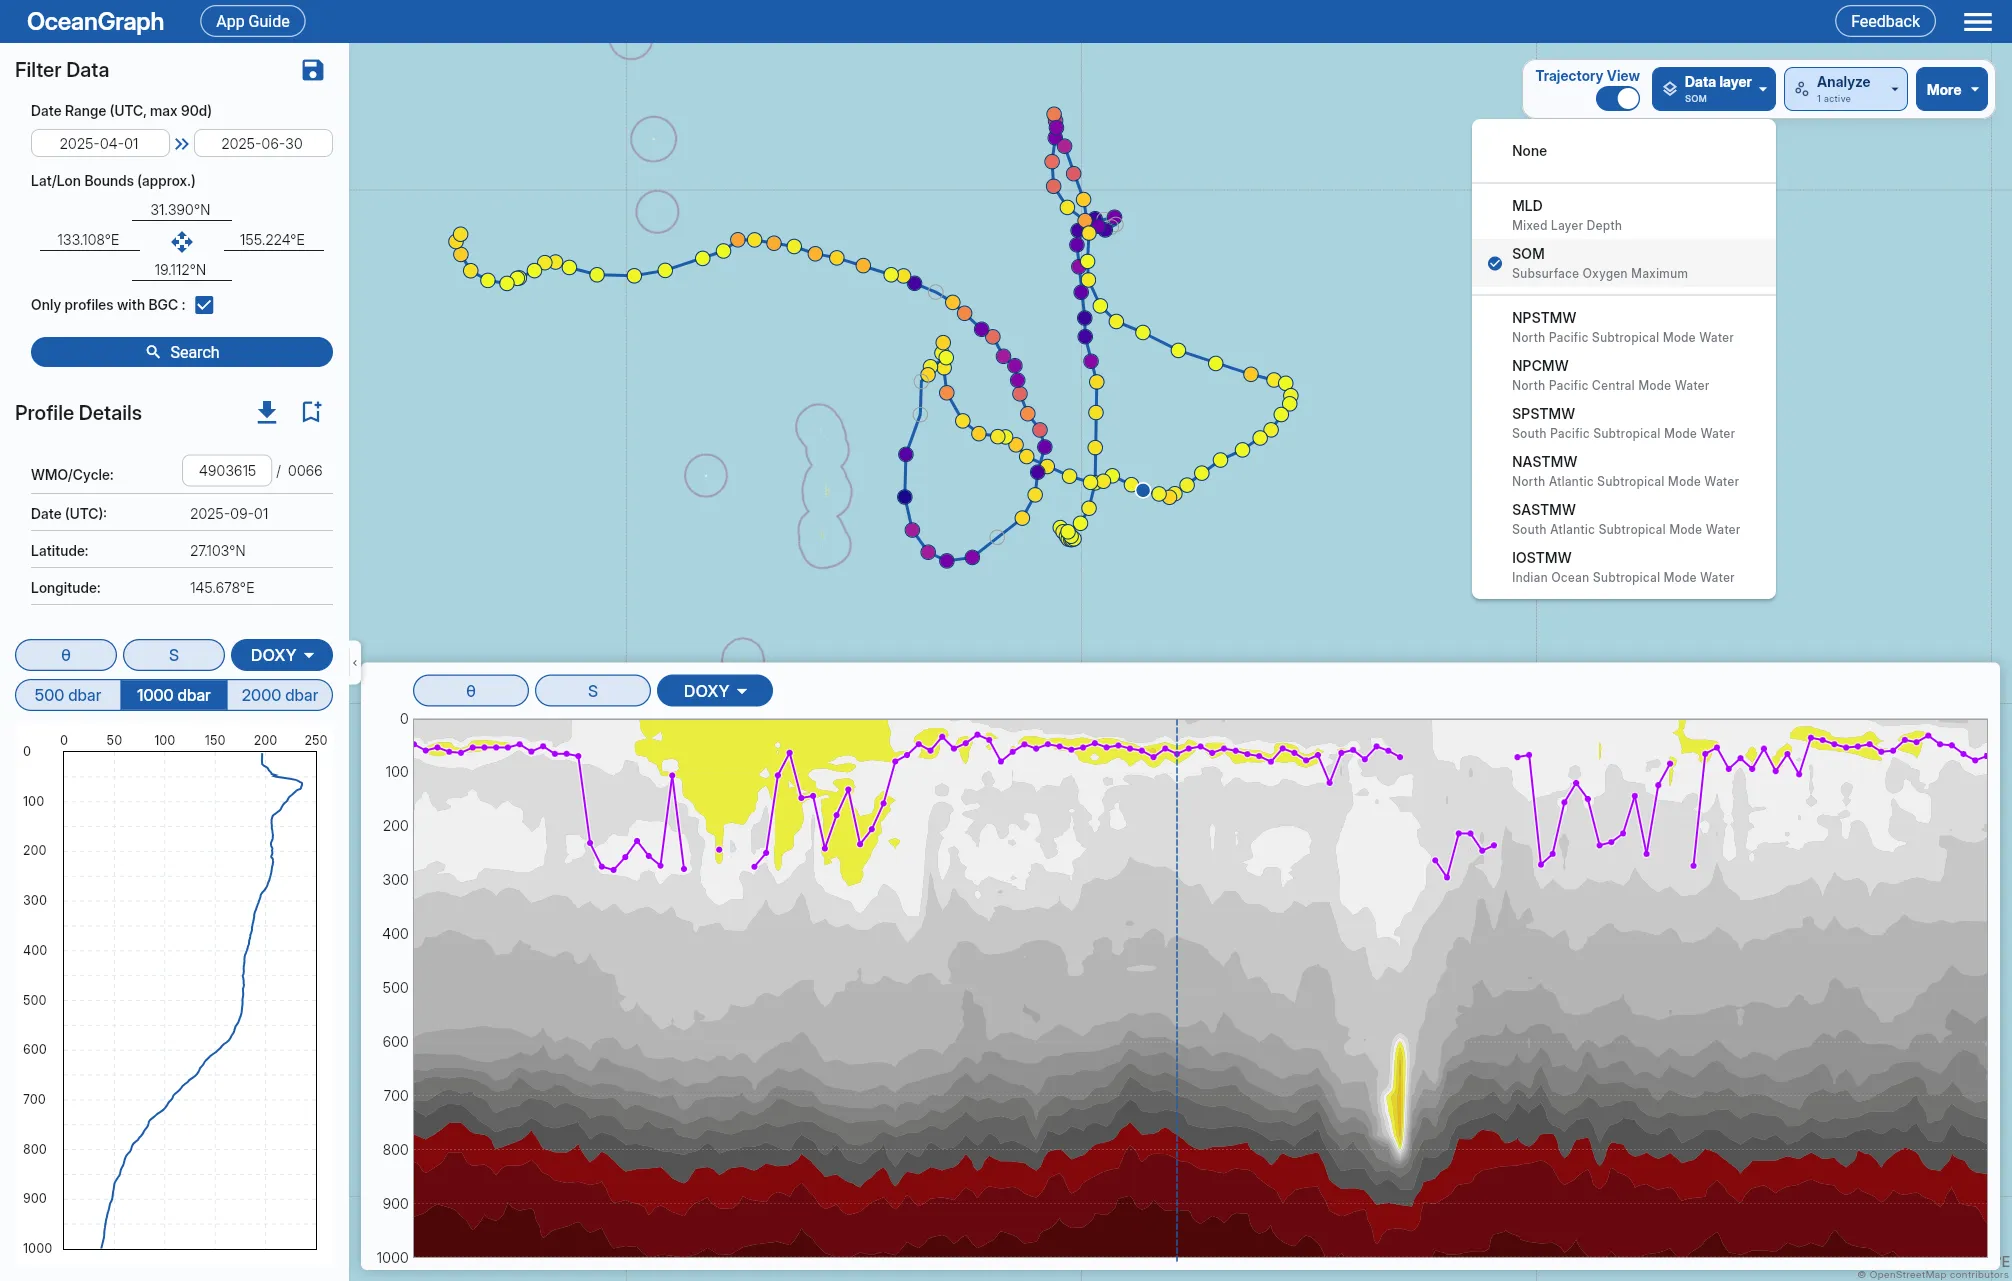
OceanGraph provides an Only profiles with BGC search option to narrow the candidates. It is not a DO-only filter, but it narrows results to profiles with at least one supported BGC parameter, making it faster to find profiles that may include oxygen.
If you want the profile-search logic first, see Finding Argo Float Profiles by Location, Time, and WMO ID.
What a Dissolved Oxygen Profile Usually Shows
Oxygen profiles vary by region and season. The following patterns give beginners a useful starting point.
Surface oxygen and recent air-sea contact
Near the surface, oxygen is influenced strongly by contact with the atmosphere and by the recent state of the upper ocean.
Surface values can change with:
- Heating and cooling, which alter oxygen solubility and can drive gas exchange
- Wind-driven mixing
- Photosynthesis and respiration
- Stratification that limits exchange with deeper water
That is one reason surface oxygen should not be interpreted without location and season.
Subsurface oxygen maxima
Some profiles show a local oxygen maximum below the immediate surface layer.
This kind of feature often appears in subtropical or tropical settings and can indicate that the upper ocean should not be treated as one uniform layer. Its cause is not unique: biological production, ventilation and subduction, advection, mixing, and the temperature-dependent solubility background can all contribute. A concentration profile alone cannot separate them.
Oxygen decline below the upper ocean
Below the well-ventilated upper ocean, dissolved oxygen often decreases.
The exact shape depends on circulation, biological consumption, and water-mass history, but the general lesson is that oxygen structure carries information that temperature and salinity alone do not fully capture.
Deep structure
At greater depth, oxygen can vary more slowly over thick layers, or it can continue to change depending on circulation, respiration, and the region.
The important beginner habit is to read the shape of the profile, not only one number.
Why You Should Read Oxygen Together With Temperature and Salinity
Oxygen interpretation becomes much stronger when it is paired with physical structure.
Temperature and salinity help answer questions such as:
- Is the surface strongly stratified or recently mixed?
- Where is the upper gradient zone?
- Does the oxygen feature sit above, within, or below a strong change in water properties?
- Do physical differences show that two oxygen profiles sample different water-property regimes, before biological causes are inferred?
A Practical Example: Reading One Oxygen Profile Step by Step
Imagine you open one BGC Argo profile from a subtropical region.
A practical reading sequence would be:
- Confirm that the profile includes dissolved oxygen.
- Check the date, latitude, longitude, WMO ID, and cycle number.
- Open temperature and salinity first to understand the physical structure.
- Open the oxygen profile and look for the surface pattern, any local maximum below it, and the deeper trend.
- Compare with nearby cycles to see whether the oxygen structure persists along the drifting float path; differences can reflect both time and location.
- Use SOM-related output if you want to highlight the subsurface maximum explicitly.
This is much easier when the search and profile views are connected.
Useful OceanGraph pages are:
What Is a Subsurface Oxygen Maximum?
A subsurface oxygen maximum is, in the physical sense, a local maximum of dissolved oxygen found below the immediate surface layer.
The practical idea is important:
- The surface value is not always the most informative oxygen value
- A meaningful oxygen feature may appear just below the mixed layer
- Comparing the depth and value of this maximum across profiles can reveal structure that is hard to see from one glance alone
OceanGraph reports a SOM only for a peak that lies below the mixed layer, stands clearly above its surroundings, and is backed by real oxygen observations rather than by interpolation alone. When MLD is available, candidate pressures run from just below MLD through 300 dbar; without MLD they run from 30 to 300 dbar, and a profile whose MLD is 300 dbar or deeper gets no SOM at all. Peak shape is judged across the whole retained observation range, so oxygen above or below the candidate range can still define a peak’s shoulders without being selected itself.
When no supported peak exists—including a profile where oxygen simply decreases with depth—SOM is left undefined instead of falling back to the largest value in range. Sparse oxygen coverage can leave a peak undefined for the same reason.
Missing oxygen remains null in the published profile. OceanGraph interpolates only between retained oxygen observations to judge peak shape and never extrapolates beyond them. It prefers adjusted oxygen, uses raw data only when the adjusted series has no finite values, and then masks QC 4, QC 9, and values outside the inclusive 0–600 µmol/kg range. Masking does not restart source selection, and other retained QC codes do not rank SOM candidates.
Exact prominence and width thresholds, the treatment of narrow peaks, and the candidate ranking rules are documented in Subsurface Oxygen Maximum (SOM) in the App Guide.
Missing Values and Quality Information
Missing values and values set to null by QC or range checks are not the same thing as real low-oxygen water. OceanGraph does not fill them in the published profile. Quality control, sensor calibration, and data mode still matter for interpretation. Argo advises non-experts not to use raw BGC values directly for scientific applications; prefer adjusted oxygen when its parameter data mode is A or D.
For profile search and comparison controls, see Visualizing Argo Float Data Without Python.