On this page
OceanGraph lets you search Argo profiles and inspect temperature, salinity, and other graphs without Python. To compare several profiles, download their JSON files and upload them to Analysis Lab.
If you are completely new to Argo itself, start with What is Argo Float? A Complete Guide to Ocean Observation Data.
For a comparison of maps, profiles, sections, T-S diagrams, and time series before choosing a workflow, see Ocean Data Visualization: Methods, Examples, and Tools.
Step-by-Step Workflow for Visualizing Argo Float Data Without Python
Here is a practical workflow you can follow.
Step 1. Open OceanGraph and start with a search
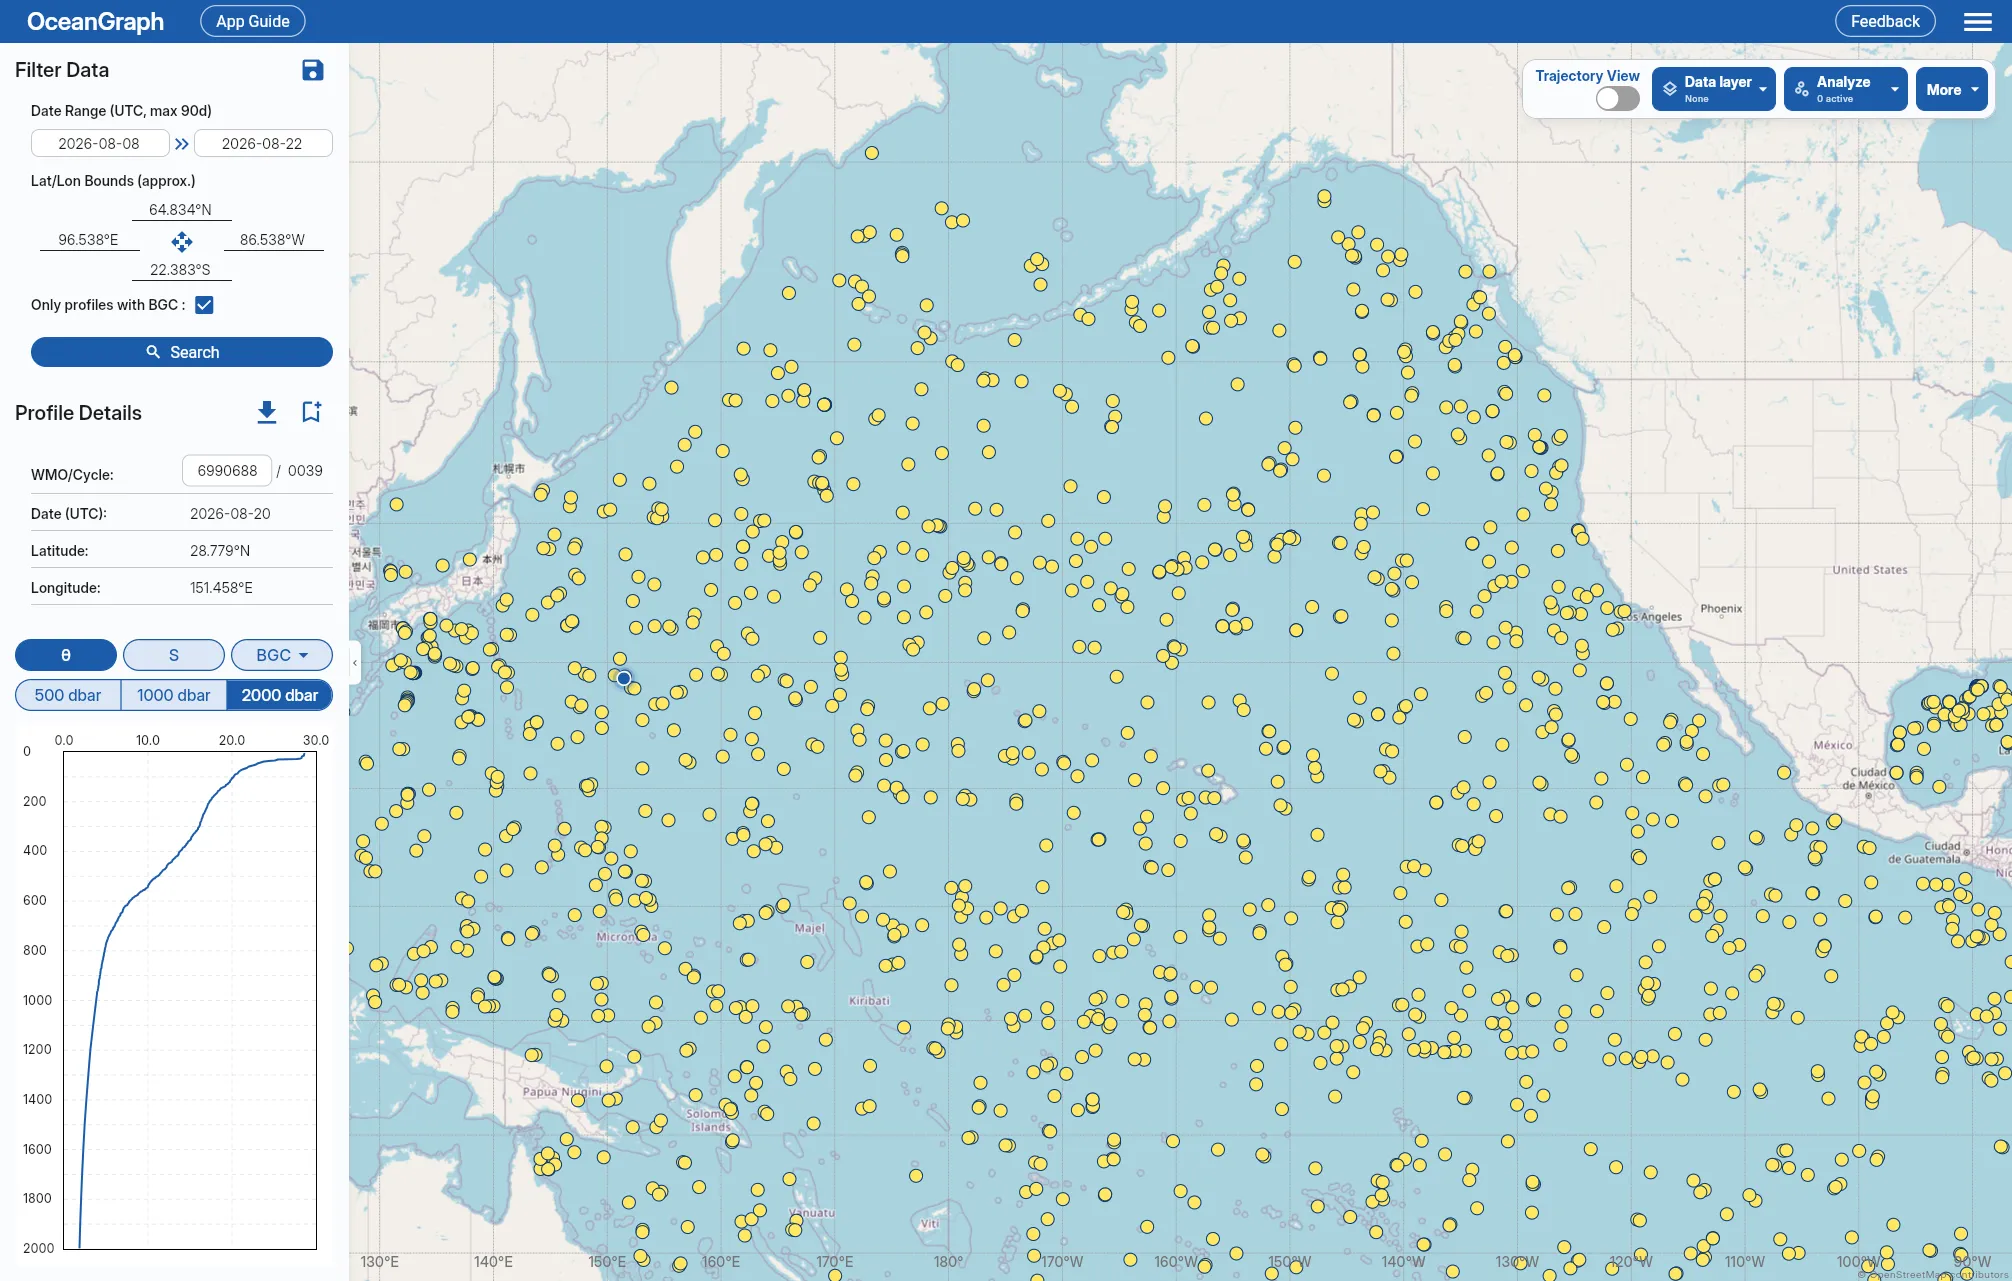
Begin in OceanGraph’s search interface and define the rough scope of the data you want to inspect.
Common starting filters include:
- Date range
- Geographic region
- A known WMO ID if you already have a specific float
- BGC data availability if you need biogeochemical profiles
The search workflow is described here:
At this stage, do not try to be too precise. Start broad enough to see what is available, then narrow the search after you recognize the profile patterns you care about.
Step 2. Check profile context before reading the graph
Once search results appear, inspect the profile metadata first:
- WMO ID
- Cycle number
- Date
- Latitude and longitude
This matters because a graph is easier to interpret when you know whether you are looking at:
- One float over time
- Several floats in the same region
- A seasonal window
- A specific event or transect-like sequence
Step 3. Open vertical profiles
The next step is usually the most important one: inspect the vertical profile.
Sign in and select a marker in the search results. The graph on the main search screen displays one selected profile at a time. You can switch between potential temperature, absolute salinity, and the available BGC variables, and choose a 500, 1,000, or 2,000 dbar pressure range.
This is where you can quickly see:
- Surface structure
- Vertically uniform layers that may be mixed
- Sharp gradients
- Subsurface maxima or minima
- Slowly varying deep-water properties
For first-pass interpretation, focus on just a few questions:
- Is the surface warm or cool relative to deeper water?
- Does salinity change gradually or in layers?
- Are there property transitions that, with geographic and depth context, may distinguish water masses?
- Do nearby cycles look similar or different?
Step 4. Compare more than one profile
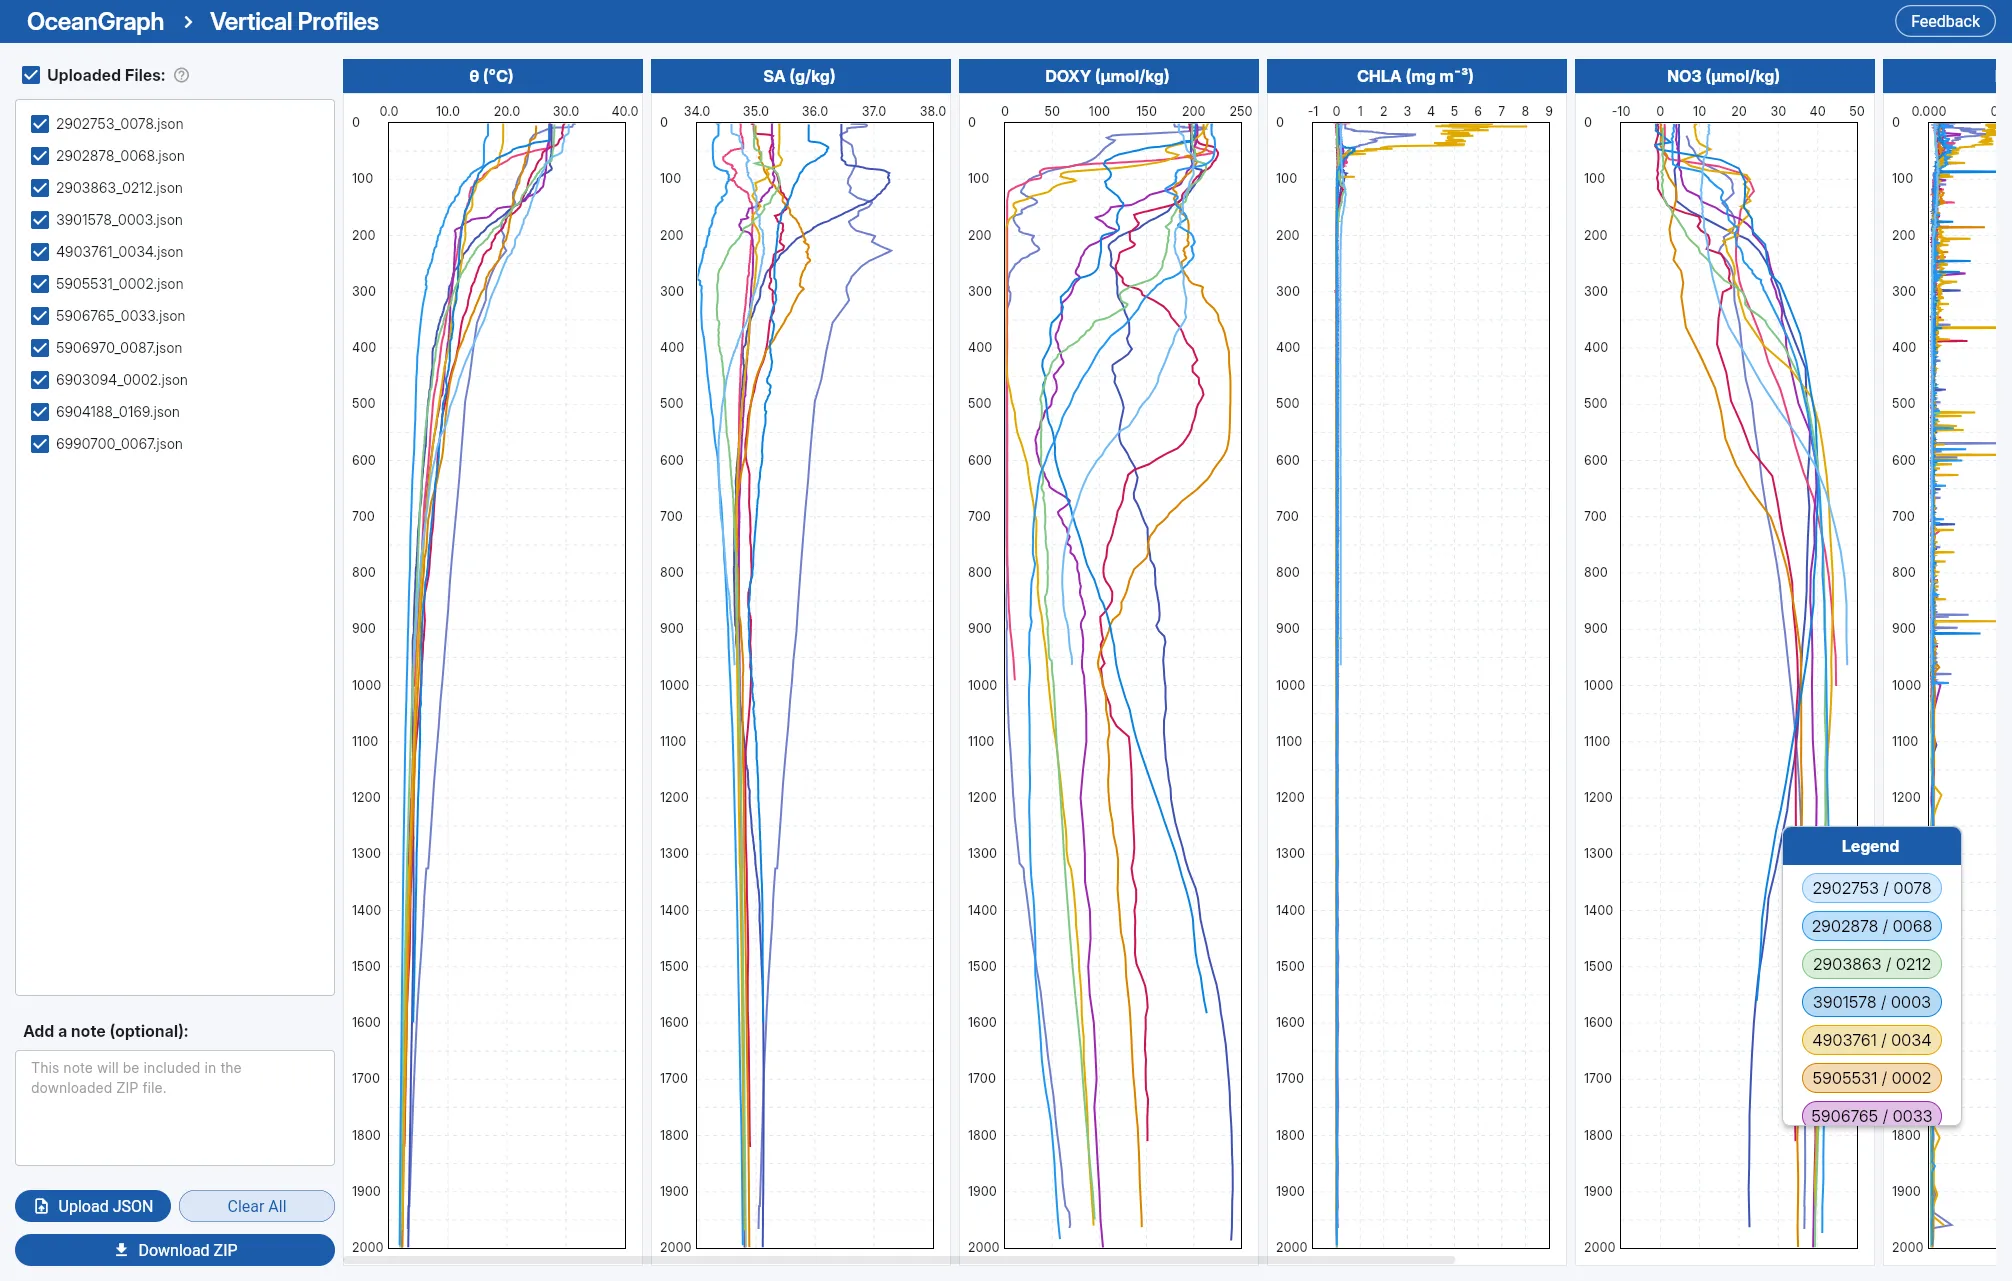
The graph on the search screen shows profiles one at a time. To place several profiles on the same charts, download each selected profile with Download profile, then open Menu > Analysis Lab > Vertical Profiles on a desktop browser. This signed-in tool accepts up to 30 downloaded or otherwise compatible Argo-format JSON files and lets you select which profiles appear.
See Analysis Lab: Vertical Profiles (JSON upload) for the controls.
Compare different cycles from the same float, nearby profiles, or similar dates in different locations to examine upper-ocean variability, deep properties, and regional patterns. Differences between cycles from one float include both temporal change and changes in location along its trajectory.
Step 5. Use a θ-S diagram when depth plots are not enough
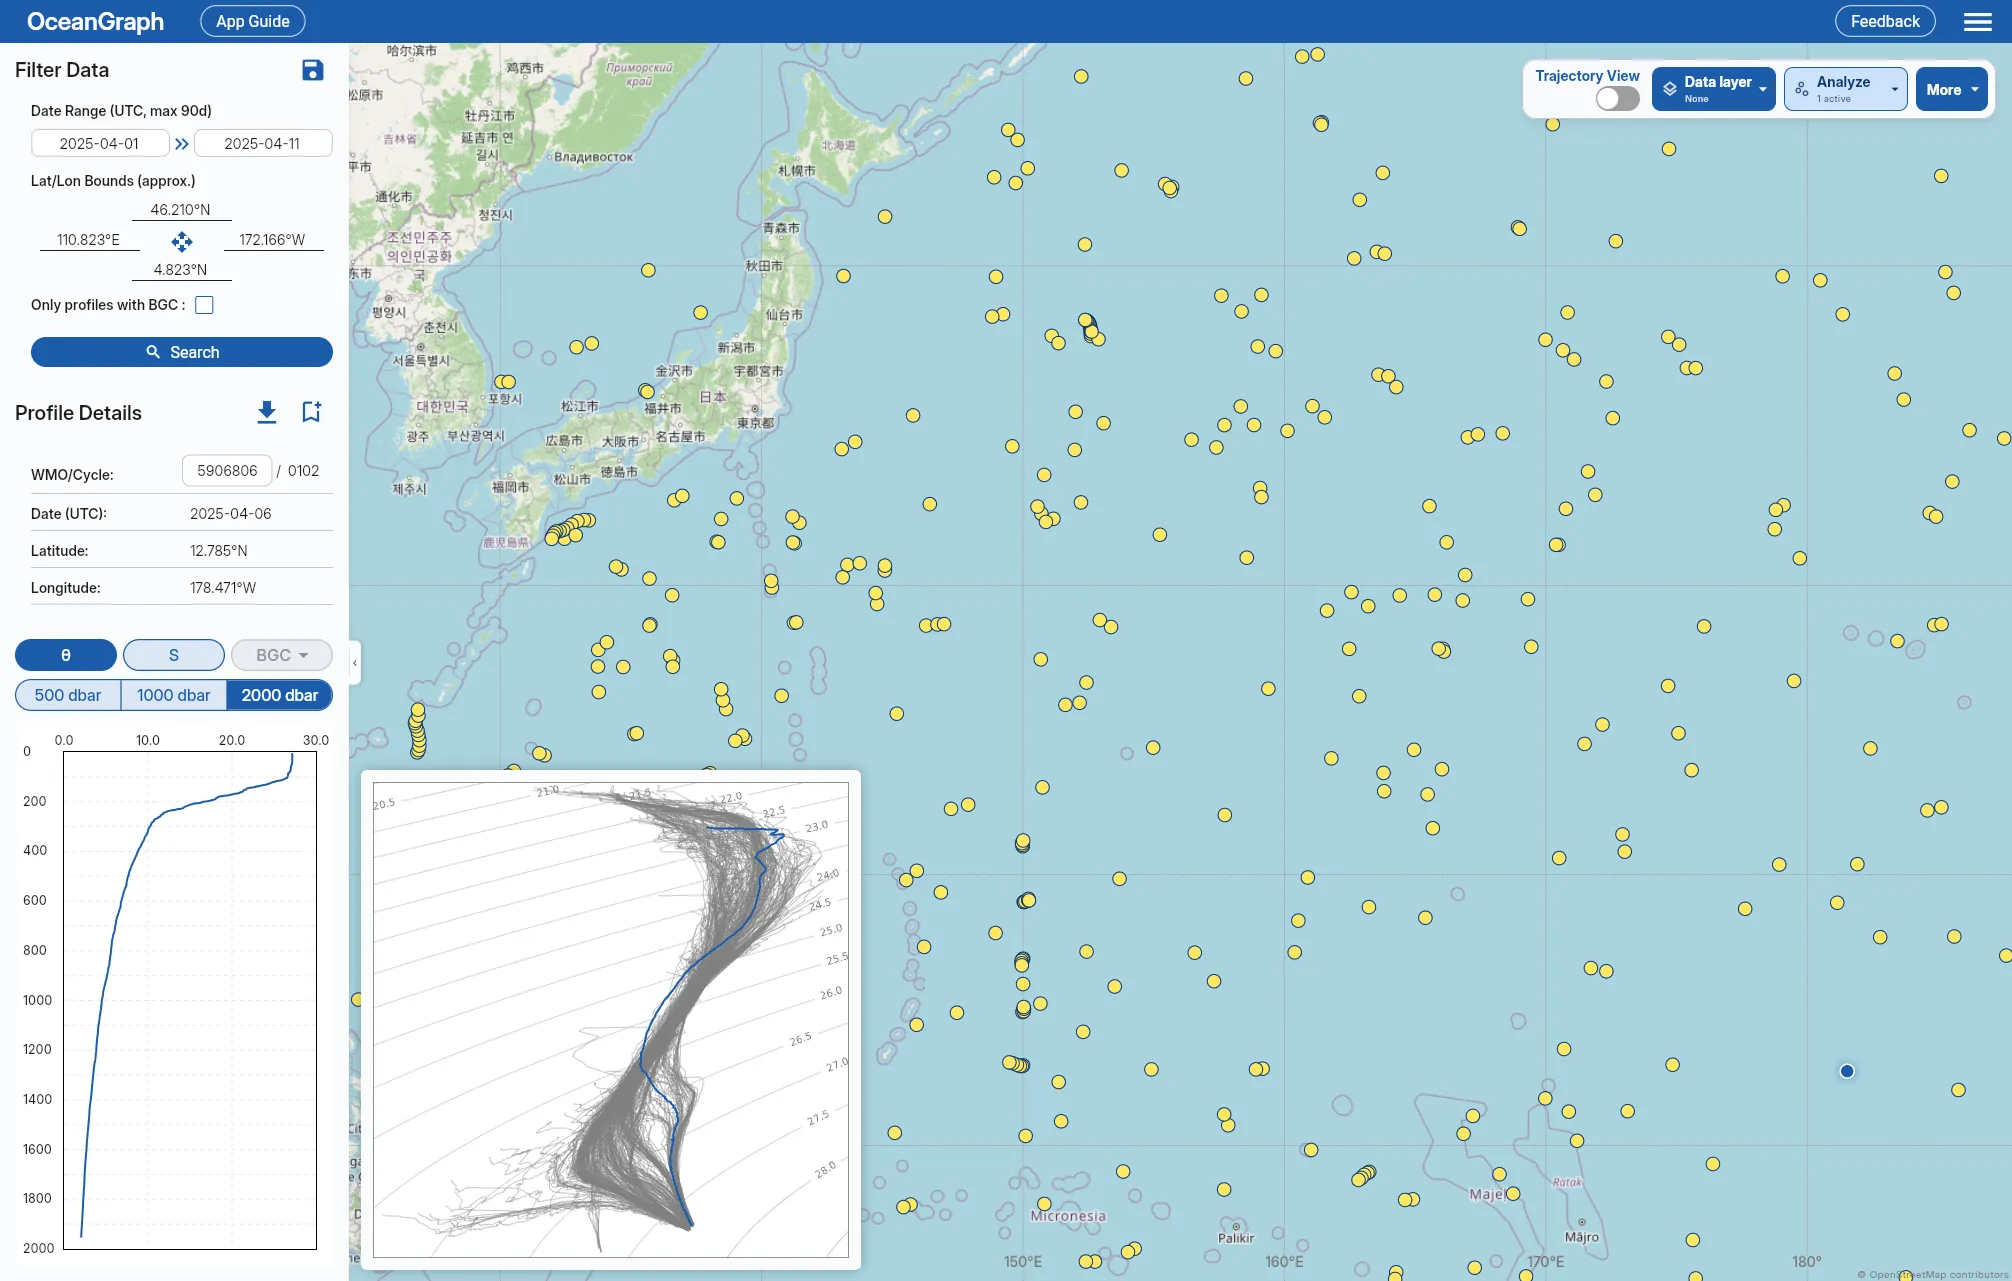
A vertical profile tells you how one variable changes with depth. A θ-S diagram helps you understand how temperature and salinity combine.
This is especially useful when you want to:
- Characterize water-mass signatures
- Compare profiles in property space
- Recognize mixing-like transitions
- Understand why two profiles that look similar in one variable may still differ physically
OceanGraph includes a dedicated guide here:
If you later download or analyze values, confirm the Argo data mode, use the corresponding raw or adjusted variables, and apply the matching quality flags and errors.
Step 6. Bookmark the profiles worth deeper analysis
Bookmark interesting profiles so you can return to them for comparison or analysis.
When No-Code Visualization Is the Better Choice
Visualizing Argo float data without Python is especially useful when:
- You are learning Argo for the first time
- You want to screen profiles before writing analysis scripts
- You are teaching or demonstrating ocean profile structure
- You need a fast view of temperature, salinity, or oxygen behavior
- You are working with collaborators who do not use coding workflows
When You Will Still Want Python Later
Eventually, code becomes important if you need to:
- Process many profiles in bulk
- Apply reproducible filters or statistics
- Merge Argo data with other datasets
- Build publication figures programmatically
- Run derived calculations beyond the built-in visual workflow
Further Reading
These are the most useful follow-up pages: