On this page
If you searched for an online version of Ocean Data View, the first thing worth knowing is that one exists and is made by the same people: webODV, developed at the Alfred Wegener Institute alongside the desktop program.
The more useful question is which stage of work you are at. Screening whether a region has the structure you expect is a different job from building a section figure for a paper, and browser tools and desktop tools are not equally good at both. This guide compares them by the work rather than by the feature list.
For a broader survey of what to plot in the first place, Ocean Data Visualization: Methods, Examples, and Tools covers the visualization types themselves.
What Desktop Ocean Data View Is For
Ocean Data View is a software package by Reiner Schlitzer at AWI, free of charge for non-commercial, non-military research and teaching, and running on Windows, macOS, and Linux. It has been widely used for exploring and publishing profile, time-series, and trajectory data for decades, and it is worth being clear about what it does well:
- Building and curating collections from many cruises, formats, and sources, then treating them as one dataset
- Colour sections along arbitrary cruise tracks, isosurface maps, and property-property plots
- Gridding, including two fast weighted-averaging algorithms and the DIVA software for more careful interpolation
- Derived variables, geostrophic velocity sections, difference fields, and animations
- Producing figures at publication quality, with full control over the result
If your output is a section figure for a manuscript, or your input is a heterogeneous collection you need to curate once and reuse, ODV is the tool for the job.
webODV: The Same Lineage, in a Browser
webODV brings ODV’s analysis into the browser as two services.
The Data Extractor handles subsetting: you step through station, variable, and format selection and receive the result as text, an ODV collection, or NetCDF. Extraction runs in the background and notifies you when it is ready, which suits requests large enough that you would not want to hold a browser tab open.
The Data Explorer reproduces much of the desktop look and feel — maps, surface plots, section plots, scatter plots, filtering — against datasets already hosted on the server. Views can be saved to an account and reopened from any browser.
Several instances exist for different data collections, including an Argo webODV and the general webODV Explore service. These services analyse collections hosted on their servers.
Argo-Specific Browser Routes
For Argo specifically, several other browser tools cover parts of the same ground:
- The Euro-Argo Data Selection tool is a search-and-download front end to the GDAC, organised around region, date, float, and parameter.
- The Argo Fleet Monitoring dashboard answers questions about a specific float — where it is, what it carries, what state its data is in.
- Argovis provides a map-based browser over Argo and related datasets, with an API behind it.
- OceanGraph focuses on reading and comparing preprocessed Argo profiles interactively, with derived indicators such as mixed layer depth available on the map.
What to Check When Choosing a Tool
For your own data, check the accepted upload formats. When comparing derived quantities, align the formulas, thresholds, and interpolation methods. Export formats such as CSV, NetCDF, and ODV collections determine how you can pass values to the next analysis step.
For an environment you can use to rerun an analysis, see How to Make a Research Analysis Reproducible with Docker.
Matching the Tool to the Task
| Task | Where it belongs |
|---|---|
| Check whether a region has the structure you expect | Browser |
| Look up one float and read its recent profiles | Browser |
| Subset the GDAC before downloading | Browser (or the index files) |
| Curate a collection from several cruises and formats | Desktop ODV |
| Build a publication-quality section figure | Desktop ODV |
| Grid data with DIVA or a custom derived variable | Desktop ODV |
| Run the same analysis over thousands of profiles | Scripted workflow |
| Combine Argo with another dataset | Scripted workflow |
Where OceanGraph Sits
OceanGraph supports searching profiles by region, time, and WMO ID, reading a selected vertical profile directly, comparing downloaded profiles side by side, and using derived indicators such as mixed layer depth to see how a property varies across many profiles at once.
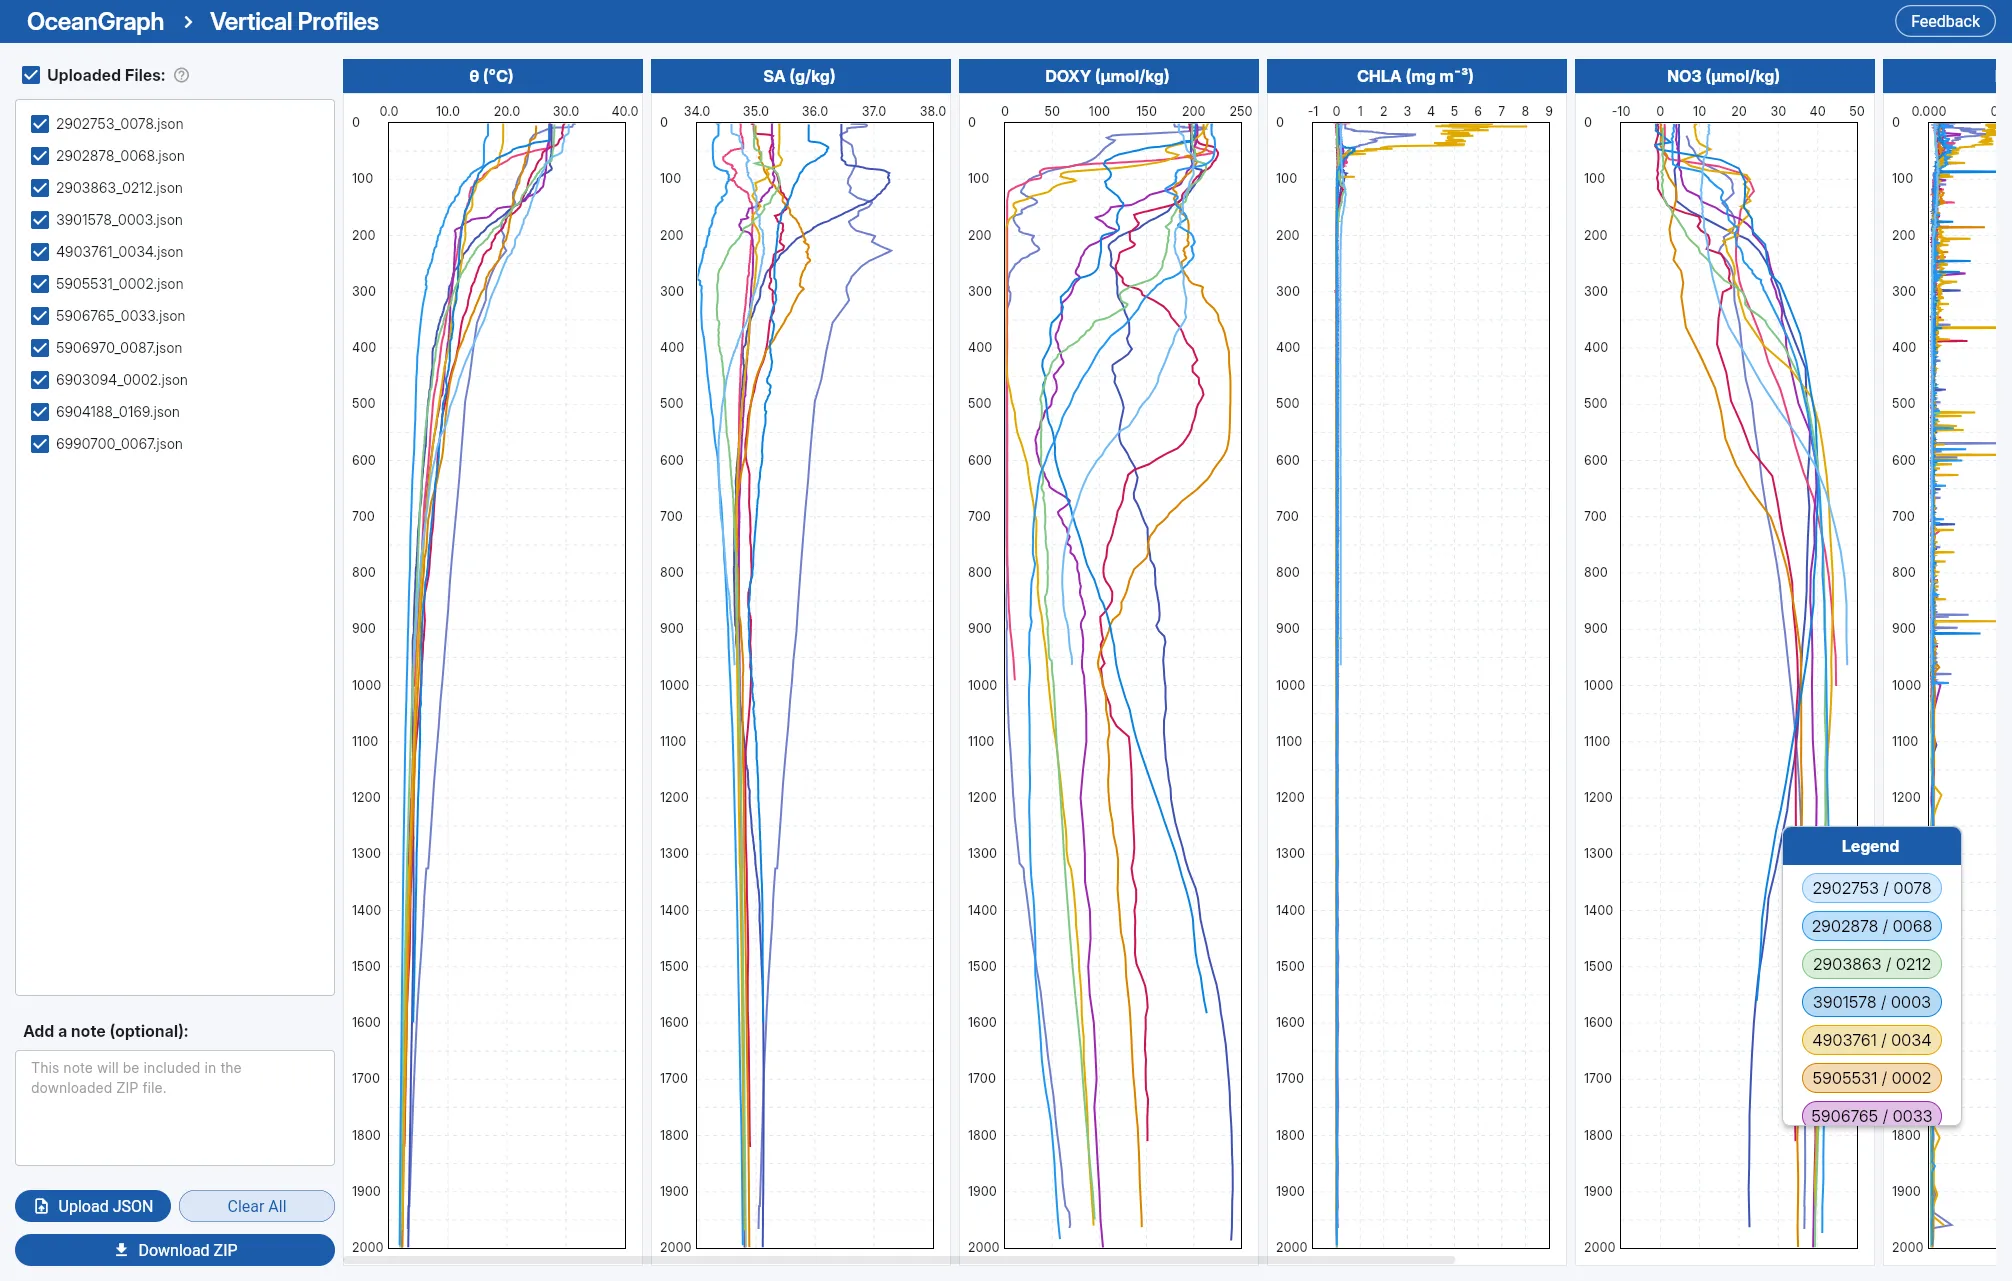
The step-by-step workflow is in Visualizing Argo Float Data Without Python, and the App Guide documents Search and Bookmark and Analysis Lab: Vertical Profiles (JSON upload).
For a concrete example of moving to custom plotting, see Making a T-S Diagram: Python vs Interactive Tools.
Frequently Asked Questions
Can I use a browser tool with my own data files?
It depends on the tool and is the main structural difference from desktop software. Most browser services analyse collections they host. Some accept uploads in a specific format — OceanGraph’s Analysis Lab, for example, takes Argo-format JSON profiles.
Do browser tools give the same numbers as ODV?
For the same source data and the same operation, the underlying values are the same data. Differences appear in derived quantities, where the choice of algorithm, threshold, or interpolation matters. Compare the documented definitions rather than assuming two tools mean the same thing by the same label.
Does using a browser tool mean I can skip quality control?
A plausible-looking plot does not establish data quality. Check the data mode and quality flags when selecting values for analysis.