

On this page
If you are new to oceanography, one of the first terms you will encounter is Argo float. Argo floats are autonomous instruments that drift through the ocean, dive below the surface, and return measurements that help scientists understand how the ocean changes over time.
They matter because ocean conditions are not static. Temperature, salinity, oxygen, and other properties vary with depth, season, and location. To understand the real structure of the ocean, you need more than a surface map. You need vertical profiles collected repeatedly across the globe. That is exactly what Argo provides.
What Is an Argo Float?
An Argo float is an autonomous profiling float used for ocean observation. It is part of the International Argo Program, a global effort to collect consistent, repeat observations of the upper and middle ocean.
Each float spends most of its time below the sea surface. It drifts with ocean currents, dives to a target depth, then rises back toward the surface while measuring the water column. After surfacing, it sends its observations through satellite communication before beginning the next cycle.
Argo transformed ocean observation because it made subsurface measurements more routine, global, and comparable. Before Argo, many measurements depended on ship campaigns, which were valuable but limited in time and space.
For a broader comparison of what satellites, ships, moorings, and profiling floats can each observe, see How Do Scientists Measure the Ocean?.
Why Argo Floats Matter
Argo floats fill a major observational gap between two older approaches:
- Satellites give broad coverage, but they mainly observe the ocean surface
- Ships can measure the water column directly, but only along limited routes and schedules
Argo floats provide a third kind of observing system: repeated subsurface measurements across wide areas of the ocean. That makes them useful for:
- Tracking changes in temperature and salinity
- Understanding seasonal and regional ocean structure
- Studying water masses and mixing
- Monitoring ocean heat content
- Supporting climate research and model validation
For students and early-career researchers, Argo is often the easiest entry point into large-scale ocean observation data because the measurements are physically meaningful and organized as profiles.
Ocean heat content is not the same as sea surface temperature. Why Sea Surface Temperature Is Not Enough to Measure Ocean Warming explains why profiles through depth are needed.
How Does an Argo Float Work?
A typical Argo float follows a repeating cycle:
- It starts near the surface after transmitting data.
- It sinks to a drift depth, often around 1,000 meters.
- It drifts with currents for several days.
- It then sinks deeper, often to around 2,000 meters.
- It rises toward the surface while recording measurements through the water column.
- Once at the surface, it sends the profile and position data by satellite.
- The cycle repeats.
A single float builds a time series of vertical ocean profiles along its drifting path.
What Does an Argo Float Measure?
The core Argo system is best known for measuring:
- Pressure
- Temperature
- Salinity
In practice, salinity is derived from conductivity, temperature, and pressure measurements. These variables are enough to describe a large part of the ocean’s physical structure.
Some Argo floats carry additional sensors, especially in biogeochemical programs. Depending on the float, you may also encounter:
- Dissolved oxygen
- Chlorophyll-related optical measurements
- Nitrate
- pH
- Particle backscatter
- Light-related variables such as irradiance
This is why Argo data is useful across different levels of oceanography. A beginner may start with temperature and salinity profiles, while a more advanced user may move into oxygen, optical and chemical proxies, biogeochemical cycling, or water-mass analysis. Chlorophyll fluorescence, for example, serves as a proxy rather than a direct measurement of primary productivity.
What Does Argo Data Look Like?
Argo data is usually organized around floats and cycles.
Some of the most common concepts are:
| Term | Meaning |
|---|---|
| WMO ID | The identifier for a specific float |
| Cycle number | The sequence number for one operational cycle of a float |
| Profile | One vertical sampling scheme stored for a cycle, usually collected during ascent |
| Trajectory | The float positions through time |
| Pressure levels | The sampled points through the water column |
If you open an Argo data file, you will usually see arrays of values for pressure, temperature, salinity, time, location, quality flags, and metadata. That structure is powerful, but it can also be intimidating if you are new to NetCDF files or oceanographic naming conventions.
For many users, the first practical views of Argo data are not the raw files themselves but visual products such as:
- Temperature vs depth
- Salinity vs depth
- Oxygen vs depth
- Float trajectory maps
- Temperature-salinity or theta-salinity diagrams
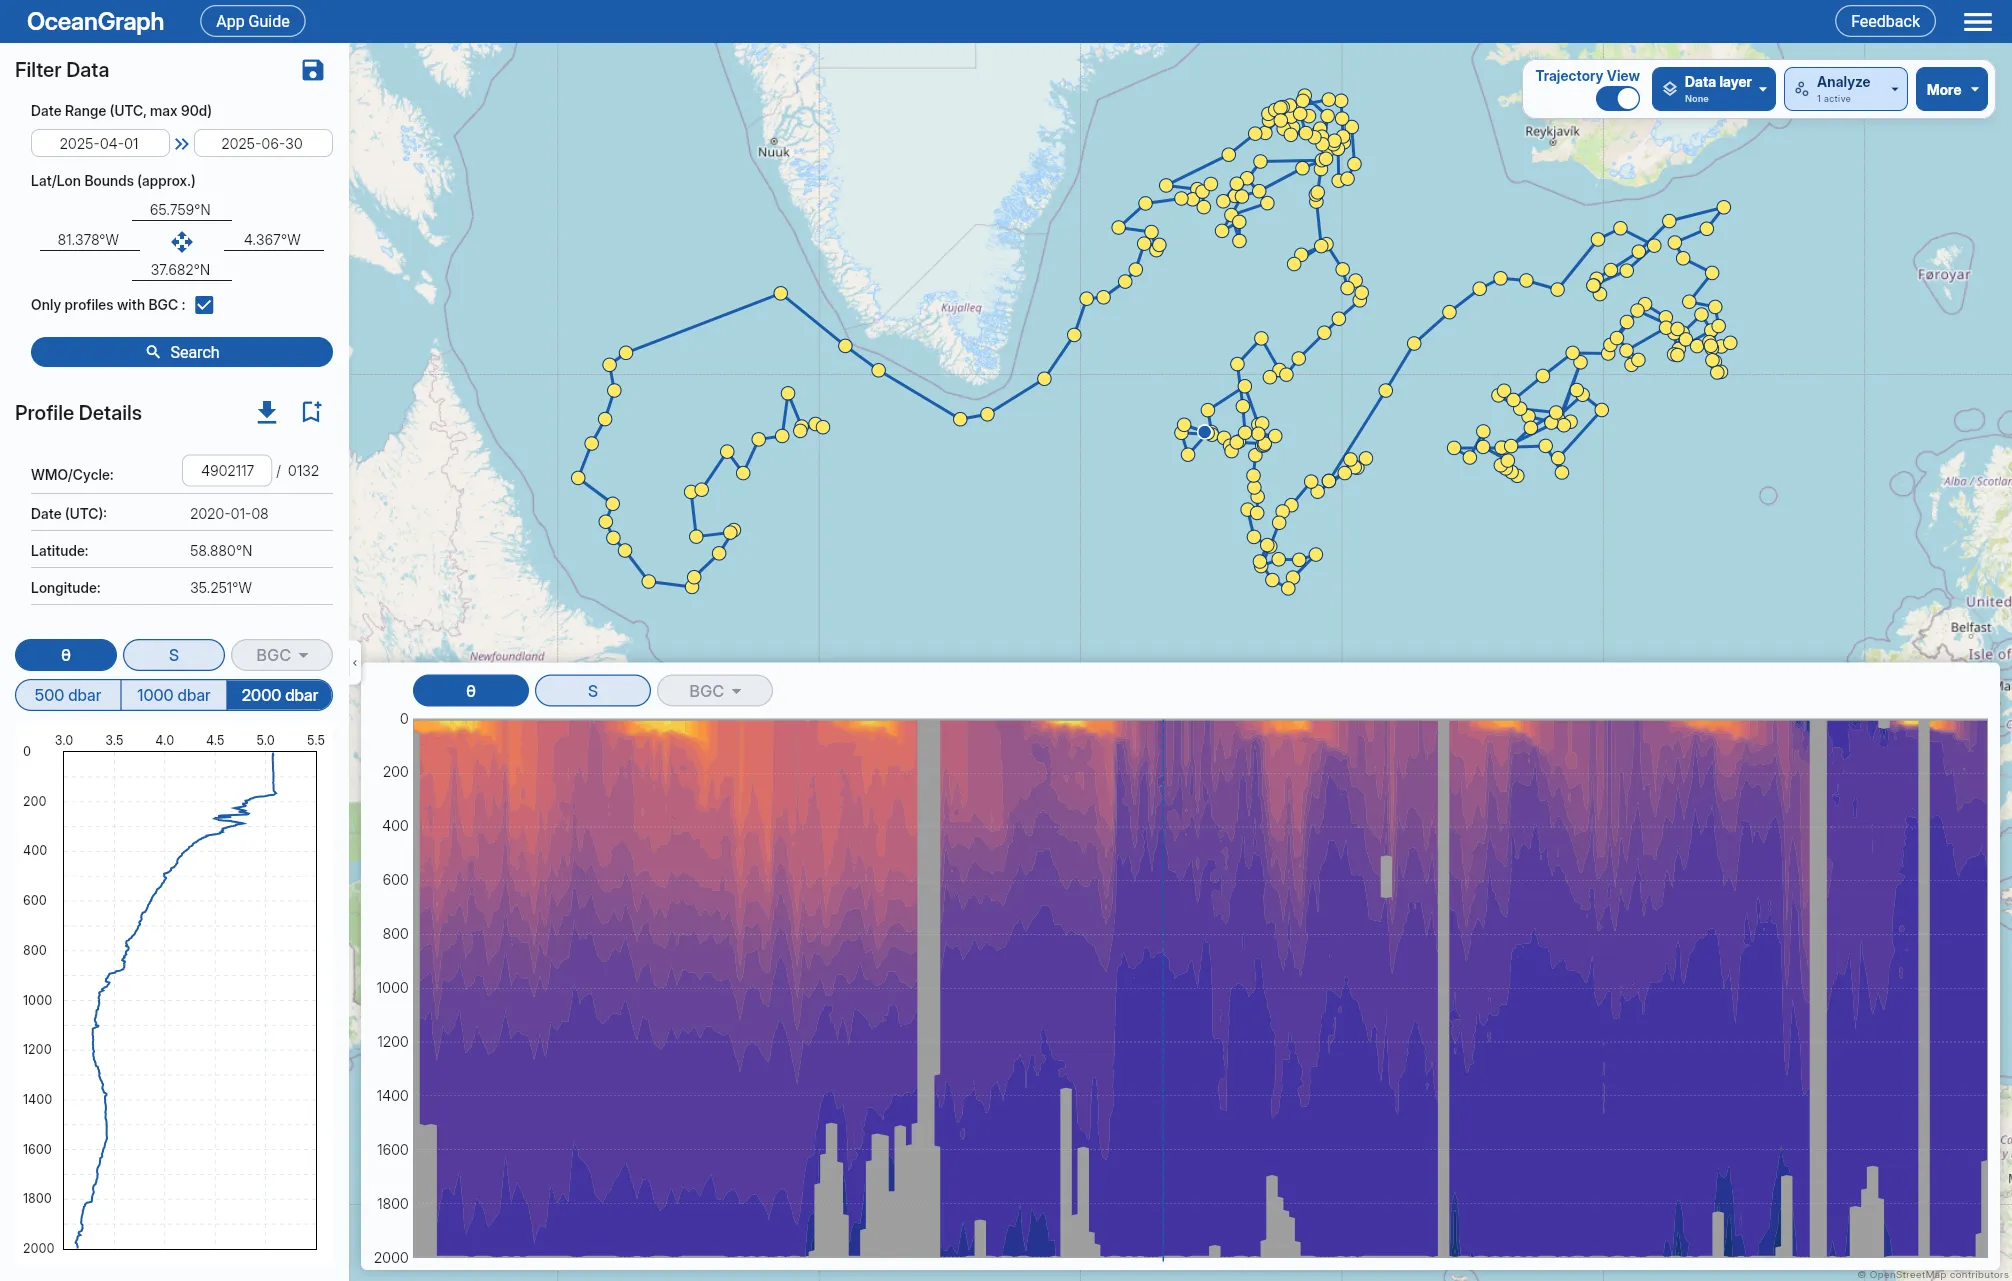
Those visualizations are often the fastest way to build intuition before moving into full Argo float data analysis.
Core Argo, BGC Argo, and Deep Argo
You may also hear about several related Argo categories:
- Core Argo focuses mainly on physical variables such as temperature and salinity
- BGC Argo adds biogeochemical sensors such as oxygen, nitrate, pH, or optical variables
- Deep Argo extends observations deeper than the standard core profiling range
How Beginners Should Read Argo Profiles
1. Start with place and time
Before looking at any profile, check:
- Where was the float?
- When was the profile taken?
- Is it one profile or part of a sequence?
2. Look at one variable against depth
A temperature profile can suggest:
- Surface warming
- Thermally uniform upper layers that may be mixed layers
- Sharp gradients
- Slowly varying deep properties
A salinity profile can show you:
- Fresh surface layers
- Salty subsurface water
- Vertical structure associated with different water masses
3. Compare multiple cycles
One profile is useful. A sequence of profiles is much better. Comparing nearby cycles helps you see whether a feature persists along the float’s path. Because the float drifts, differences between cycles can reflect both time and location, not time alone.
4. Use a T-S diagram to understand water masses
A depth profile shows vertical structure. A T-S diagram shows how temperature and salinity relate to each other. Both views matter. If you want to understand water-mass structure, mixing, or the identity of different layers, a T-S view becomes especially useful.
OceanGraph includes a dedicated guide for θ-S Diagram, which is a good next step after learning the basics.
When you are ready to work through flags, data modes, and adjusted values, continue with Argo Data Quality Control Guide: QC Flags and Adjusted vs. Raw Data.
A Better First Step: Explore Before You Code
Before writing scripts, it helps to answer simpler questions first:
- What does a real Argo profile look like?
- How does one float change over time?
- What does a water mass pattern look like in profile space?
- Which profiles are worth deeper analysis later?
OceanGraph is designed for that stage of work. Instead of starting with file parsing, you can start with interpretation.
With OceanGraph, you can:
- Search Argo profiles by region, time, and WMO ID
- Inspect trajectories and time-series sections
- View selected vertical profile graphs
- View θ-S diagrams to understand water-mass structure
Useful starting points:
- Exploring Argo Data Before You Write Code
- Search and Bookmark
- Analysis Lab: Vertical Profiles (JSON upload)
- θ-S Diagram
Frequently Asked Questions
Is an Argo float the same as a buoy?
No. A surface buoy usually stays near the surface or at a fixed location. An Argo float is designed to move vertically through the water column and drift between cycles.
What is the difference between a float and a profile?
A float is the instrument. A profile is one vertical sampling scheme, usually a set of measurements collected during ascent. Some Argo missions and version-3 profile files also contain descent profiles or more than one sampling scheme for the same cycle.