

On this page
Argo profiles include quality-control (QC) flags, a data mode, and often adjusted values alongside the raw measurements. These quality fields help you choose which values to use in an analysis.
If floats, cycles, and profiles are still unfamiliar, begin with What is Argo Float? A Complete Guide to Ocean Observation Data before working through the quality fields.
If you want the broader file structure first, read Argo NetCDF Format Explained for Beginners, which introduces QC and adjusted variables at a high level.
Why Argo Quality Control Matters
Argo floats are autonomous instruments operating for years at sea. Sensors drift, some measurements are affected by biofouling or calibration issues, and communication can introduce errors. Argo’s quality system exists to flag and, where possible, correct these issues, so that a value’s numeric reliability is documented alongside the value itself.
Treating unverified and verified data the same way can bias results, especially when working across many floats and years.
What Argo QC Flags Are
Every core variable, including pressure, temperature, and salinity, has a matching QC flag variable (PRES_QC, TEMP_QC, PSAL_QC). Position and time also have their own QC flags (POSITION_QC, JULD_QC).
The flag scale is not binary. It ranges from “no QC performed” to categories such as good data, probably good data, and bad data, plus a distinct flag for values that were estimated rather than directly measured. This is why filtering on “good” data means selecting a specific set of acceptable flag values, not just excluding an obvious “bad” flag.
OceanGraph’s own filtering illustrates one product-specific rule. Only profiles with JULD_QC and POSITION_QC values of 1, 2, or 8 are used. Pressure rows also require PRES_QC in that set, but a temperature or salinity cell that cannot be used is kept as an explicit missing value on the shared pressure axis. Derived calculations use only the finite inputs they require.
Real-Time vs Delayed-Mode Data
Argo data reaches users in more than one stage, identified by a DATA_MODE value:
- Real-time (
R): available within about a day of the observation, checked with automated tests only - Real-time adjusted (
A): real-time data that has already received an automated adjustment - Delayed-mode (
D): reviewed later by a human expert through delayed-mode quality control (DMQC), which can catch sensor drift and calibration issues that automated checks miss
DMQC takes considerably longer than automated checks, and Core Argo delayed-mode files are typically not released until roughly one to two years after the observation was collected, sometimes sooner. This creates a practical trade-off: real-time data is available sooner but has had less scrutiny, while delayed-mode data is more reliable but arrives much later.
When both are available for the same cycle, delayed-mode data is preferred. OceanGraph applies that preference to core D versus R profiles and to synthetic SD versus SR profiles. It reads BGC variables from the selected synthetic profile rather than replaying separate B-files.
Adjusted vs Raw Values: Which Should You Use?
Alongside the raw variable (for example TEMP), Argo files can carry an adjusted counterpart (TEMP_ADJUSTED) with its own QC flag (TEMP_ADJUSTED_QC). The adjusted value reflects corrections such as sensor calibration or drift adjustment.
A practical selection rule is:
- Use the adjusted variable when it, along with its matching QC flag, is present and contains valid data.
- Fall back to the raw variable and its own QC flag only when the adjusted variable is missing or entirely invalid.
- Never pair a raw value with an adjusted QC flag, or an adjusted value with a raw QC flag. QC flags describe the specific variable they are attached to.
For a full profile to use adjusted core values, all three of PRES_ADJUSTED, TEMP_ADJUSTED, and PSAL_ADJUSTED need to be present and valid together. This rule, used by OceanGraph’s own processing, keeps pressure, temperature, and salinity internally consistent within one profile rather than mixing adjustment states across variables.
BGC Parameters Follow the Same Logic, Per Parameter
Biogeochemical (BGC) variables such as dissolved oxygen, chlorophyll, and pH select adjusted values first and fall back to raw independently for each parameter. A single profile can therefore use adjusted data for one BGC parameter and raw data for another. OceanGraph then masks QC 4 (bad data), QC 9 (missing value), and values outside the selected source’s configured range. Masking does not restart source selection, and no BGC profile-level QC ratio is applied. Other in-range QC codes remain and require interpretation. Argo’s own guidance for non-experts is to avoid using raw BGC values directly in scientific work; when the data mode is A or D, treat the adjusted value as the more reliable choice.
A Practical Example: Choosing Data for One Profile
Imagine you have opened one Argo core profile.
- Check
DATA_MODE. If it isD, delayed-mode review has already happened for this cycle. - Check whether
PRES_ADJUSTED,TEMP_ADJUSTED, andPSAL_ADJUSTEDare all present and valid. If so, use them together withPRES_ADJUSTED_QC,TEMP_ADJUSTED_QC, andPSAL_ADJUSTED_QC. - If any adjusted core variable is missing, use the raw
PRES,TEMP, andPSALtogether with their own QC flags instead. - Confirm that, for each of pressure, temperature, and salinity independently, at least 80% of that variable’s QC flags across the whole profile are 1, 2, or 8. A profile that fails this check for any one of the three variables is excluded entirely, before any individual layer is selected.
- Keep the finite, acceptable-QC pressure rows. Before TEOS-10 conversion, mask temperature outside -2.5–40.0 °C and practical salinity outside 2–41 without rerunning the earlier 80% profile check. Calculate potential temperature from the remaining temperature-salinity pairs and Absolute Salinity from valid salinity rows. Unavailable derived values remain
null; no second range is applied to them. - Select adjusted or raw values independently for each BGC parameter, then mask QC 4, QC 9, and values outside that source’s range. Keep the remaining finite cells with their QC meaning, and do not reselect raw data after masking.
How OceanGraph Applies These Rules For You
OceanGraph’s data pipeline applies this filtering logic automatically before a profile appears in search results.
Source-range and QC masks are applied cell by cell. Missing and masked cells remain null rather than being interpolated in Profile JSON, and a profile is omitted if no finite temperature, salinity, or BGC value survives. The 0–2000 dbar pressure guard remains separate, and derived temperature and salinity receive no second numeric range.
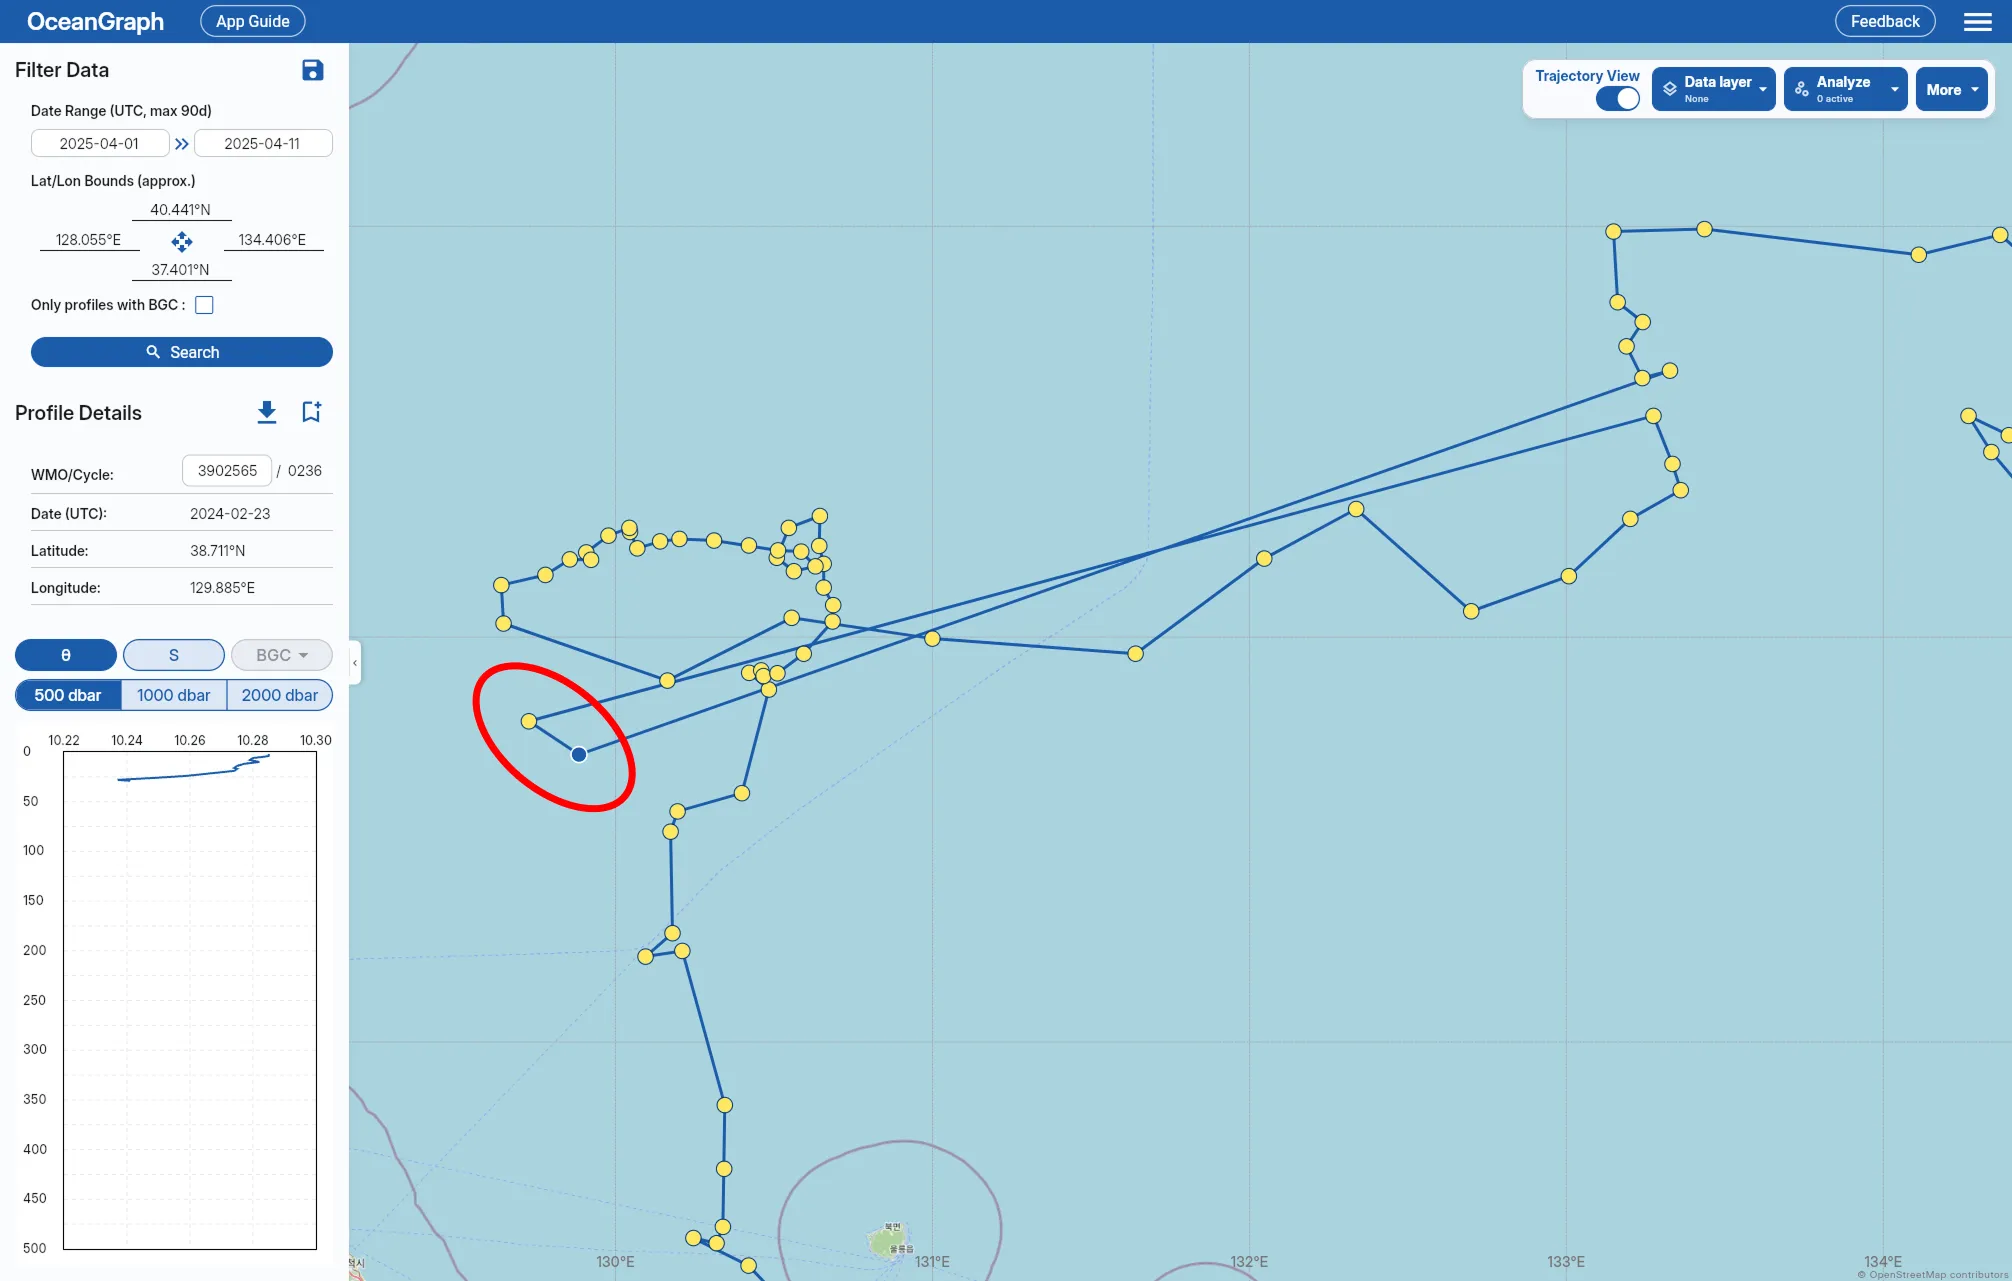
The image above shows a position that passes POSITION_QC but stands out from the surrounding trajectory. Check the source data for such positions before using them in an analysis.
Missing Values Versus Low or Zero Measurements
A missing value after QC filtering, or a value masked by its selected-source limit, is not the same as a genuinely low or zero measurement. Treating them the same silently distorts any statistics computed afterward.
If you pass those QC decisions on to your own tools or screens, the values need to travel with their units, their missing-value distinction, and the rules that were applied. Preserving the Meaning of Ocean Data in Web Apps describes how to carry that context across each boundary.
A Better First Step: Explore Pre-Filtered Profiles in OceanGraph
If your first goal is to understand what a region’s Argo data actually looks like, it can help to start from profiles that have already passed this filtering:
- Search by region, date, and WMO ID
- Trust that the returned profiles already reflect delayed-mode preference and the adjusted-first fallback rule
- Inspect an individual profile’s trajectory and position context before drawing conclusions from any single value
- Move to a custom, fully manual QC pipeline later, once you know which floats and periods are actually worth that investment
Useful follow-up pages are: