

On this page
Start reading Argo float data by checking where and when the profile was collected, then following temperature and salinity against pressure. Apply the quality information and compare neighboring profiles to identify surface layers, sharp transitions, and deeper structure.
If you are completely new to Argo itself, start with What is Argo Float? A Complete Guide to Ocean Observation Data.
What Argo Float Data Usually Contains
At the most basic level, one Argo profile combines:
- Context about the observation
- Measurements through the water column
- Metadata that helps you interpret the measurements correctly
The most common fields beginners need to understand are:
| Field | What it tells you |
|---|---|
| WMO ID | Which float produced the observation |
| Cycle number | Which operational cycle this is in the float’s sequence; a cycle can contain more than one profile |
| Date and time | When the profile was taken |
| Latitude and longitude | Where the float surfaced or reported |
| Pressure | The vertical sampling coordinate |
| Temperature | Thermal structure of the water column |
| Salinity | Salt content and water-mass information |
| Quality flags | Whether a value passed quality control checks |
If you want a broader explanation of how floats, profiles, and cycles relate to each other, What is Argo Float? A Complete Guide to Ocean Observation Data is the best starting point.
The First Things to Check Before Reading a Profile
Before focusing on the graph itself, check a few basics first.
1. Start with location and date
Ocean structure depends strongly on where and when the profile was taken.
A profile from the subtropical North Pacific in summer should not be interpreted the same way as one from the Southern Ocean in winter. Even before looking at the line shape, ask:
- Which ocean basin is this profile from?
- Is it coastal or open ocean?
- What season does the date imply?
- Is this a region where strong stratification, freshening, or deep mixing is common?
If you want to inspect this context directly before reading the graph, OceanGraph’s Search and Bookmark workflow is useful because it keeps date, location, WMO ID, and cycle information visible while you explore.
2. Check cycle number and profile context
Argo floats collect repeated profiles over time. That means one profile is usually part of a sequence. The cycle number helps you place the observation in that sequence.
This matters because:
- A feature may be persistent across many cycles
- A surface anomaly may appear only for one short period
- Deep properties may remain similar while upper-ocean structure changes
If you compare one cycle with nearby cycles from the same float, interpretation gets much easier. The best first question is often not “what is this line?” but “does this line look similar to the previous and next profiles?” Remember that the float drifts: a difference between cycles can be a change in time, a change in location, or both.
3. See which variables are available
Not every Argo profile contains the same variables.
Many profiles include the core physical variables:
- Pressure
- In-situ temperature
- Practical Salinity
These are the standard Argo variables PRES, TEMP, and PSAL. Applications such as OceanGraph may additionally calculate potential temperature and Absolute Salinity from them; those are derived quantities, not measurements stored in place of the core variables.
Some also include biogeochemical measurements such as:
- Dissolved oxygen
- Chlorophyll-related optical variables
- Nitrate
- pH
For beginners, it is usually best to start with temperature and salinity because they describe the basic physical structure of the water column. Once you understand those, the rest of the profile becomes easier to place in context.
How to Read the Main Variables
Once you know the profile context, move to the measurements themselves.
Temperature
A temperature profile is often the easiest place to begin.
Look for:
- A warm or cool surface layer
- A relatively uniform upper layer
- A sharp gradient below the surface
- More slowly varying deep values
These patterns can suggest whether the upper ocean is thermally stratified, recently mixed, or transitioning between seasonal states. Temperature alone cannot establish density stratification or a mixed-layer depth where salinity compensates for the temperature structure.
When reading temperature, focus first on the shape of the profile rather than any single number. A single surface value matters less than whether the profile shows a shallow warm layer, a strong thermocline, or a gradual transition.
If you want a dedicated guide to profile interpretation, see Ocean Temperature and Salinity Profiles Explained.
Salinity
Temperature is intuitive because people already think in warm and cold. Salinity is less familiar, but in oceanography it is equally important because it helps distinguish water masses and contributes to density.
A salinity profile can show:
- Surface freshening from rainfall, runoff, or ice melt
- Surface salinification from evaporation
- A halocline or strong salinity gradient
- Subsurface salinity maxima or minima
Two profiles with similar temperature structure may still represent different water-property regimes if their salinity differs. Read temperature and salinity together to examine density, vertical stability, or water masses.
Pressure and depth
Argo profiles are usually organized by pressure, not literal geometric depth.
In many practical cases, pressure is close enough to depth to support intuitive interpretation, especially for beginners. But they are not identical, and it is better to think of pressure as the actual measured vertical coordinate.
Higher pressure indicates deeper water.
Do not get stuck on the conversion at the start. Focus on the vertical structure and relative changes first. For a quantitative depth in meters, however, use a pressure-to-height conversion that includes latitude, such as the TEOS-10/GSW conversion, rather than treating decibars as exact meters.
Quality flags and missing values
Oceanographic data can contain missing, filtered, or flagged values.
When reading quality information, check the following:
- Missing points do not automatically mean the profile is useless
- Select raw or adjusted values from the appropriate data mode and use their matching QC flags
- Do not override a bad QC flag merely because the overall curve looks plausible
- Apparent spikes may be real or may reflect data issues; QC, neighboring levels, and nearby observations are needed to decide
This is one reason visual inspection is so helpful. It is often easier to notice odd structure on a graph than in a table of numbers.
A Simple Example: Reading One Argo Profile Step by Step
Imagine you open one Argo profile from a subtropical region in late summer.
A practical reading sequence would look like this:
- Check the location and date.
- Confirm which float and cycle you are looking at.
- Open the temperature profile.
- Look for the surface layer, the main gradient, and the deep structure.
- Open the salinity profile and ask whether it reinforces or changes your first interpretation.
- Compare with nearby cycles or nearby profiles.
- Use a T-S style view if you want to understand the water-mass relationship more clearly.
Suppose the temperature profile shows:
- Warm surface water
- A clear thermocline below it
- More slowly varying deeper values
Then the salinity profile shows:
- Slightly fresher surface water
- A saltier subsurface layer
- More slowly varying deep salinity
Together, these features suggest a stratified upper ocean, surface modification processes, and a subsurface layer with distinct water properties.
If you compare two nearby cycles and see similar deep properties while the surface layer changes, you have evidence of variability along the float’s drifting path. If you open a θ-S view and see a compact deep-water cluster plus a broader surface spread, that interpretation gains useful property-space context.
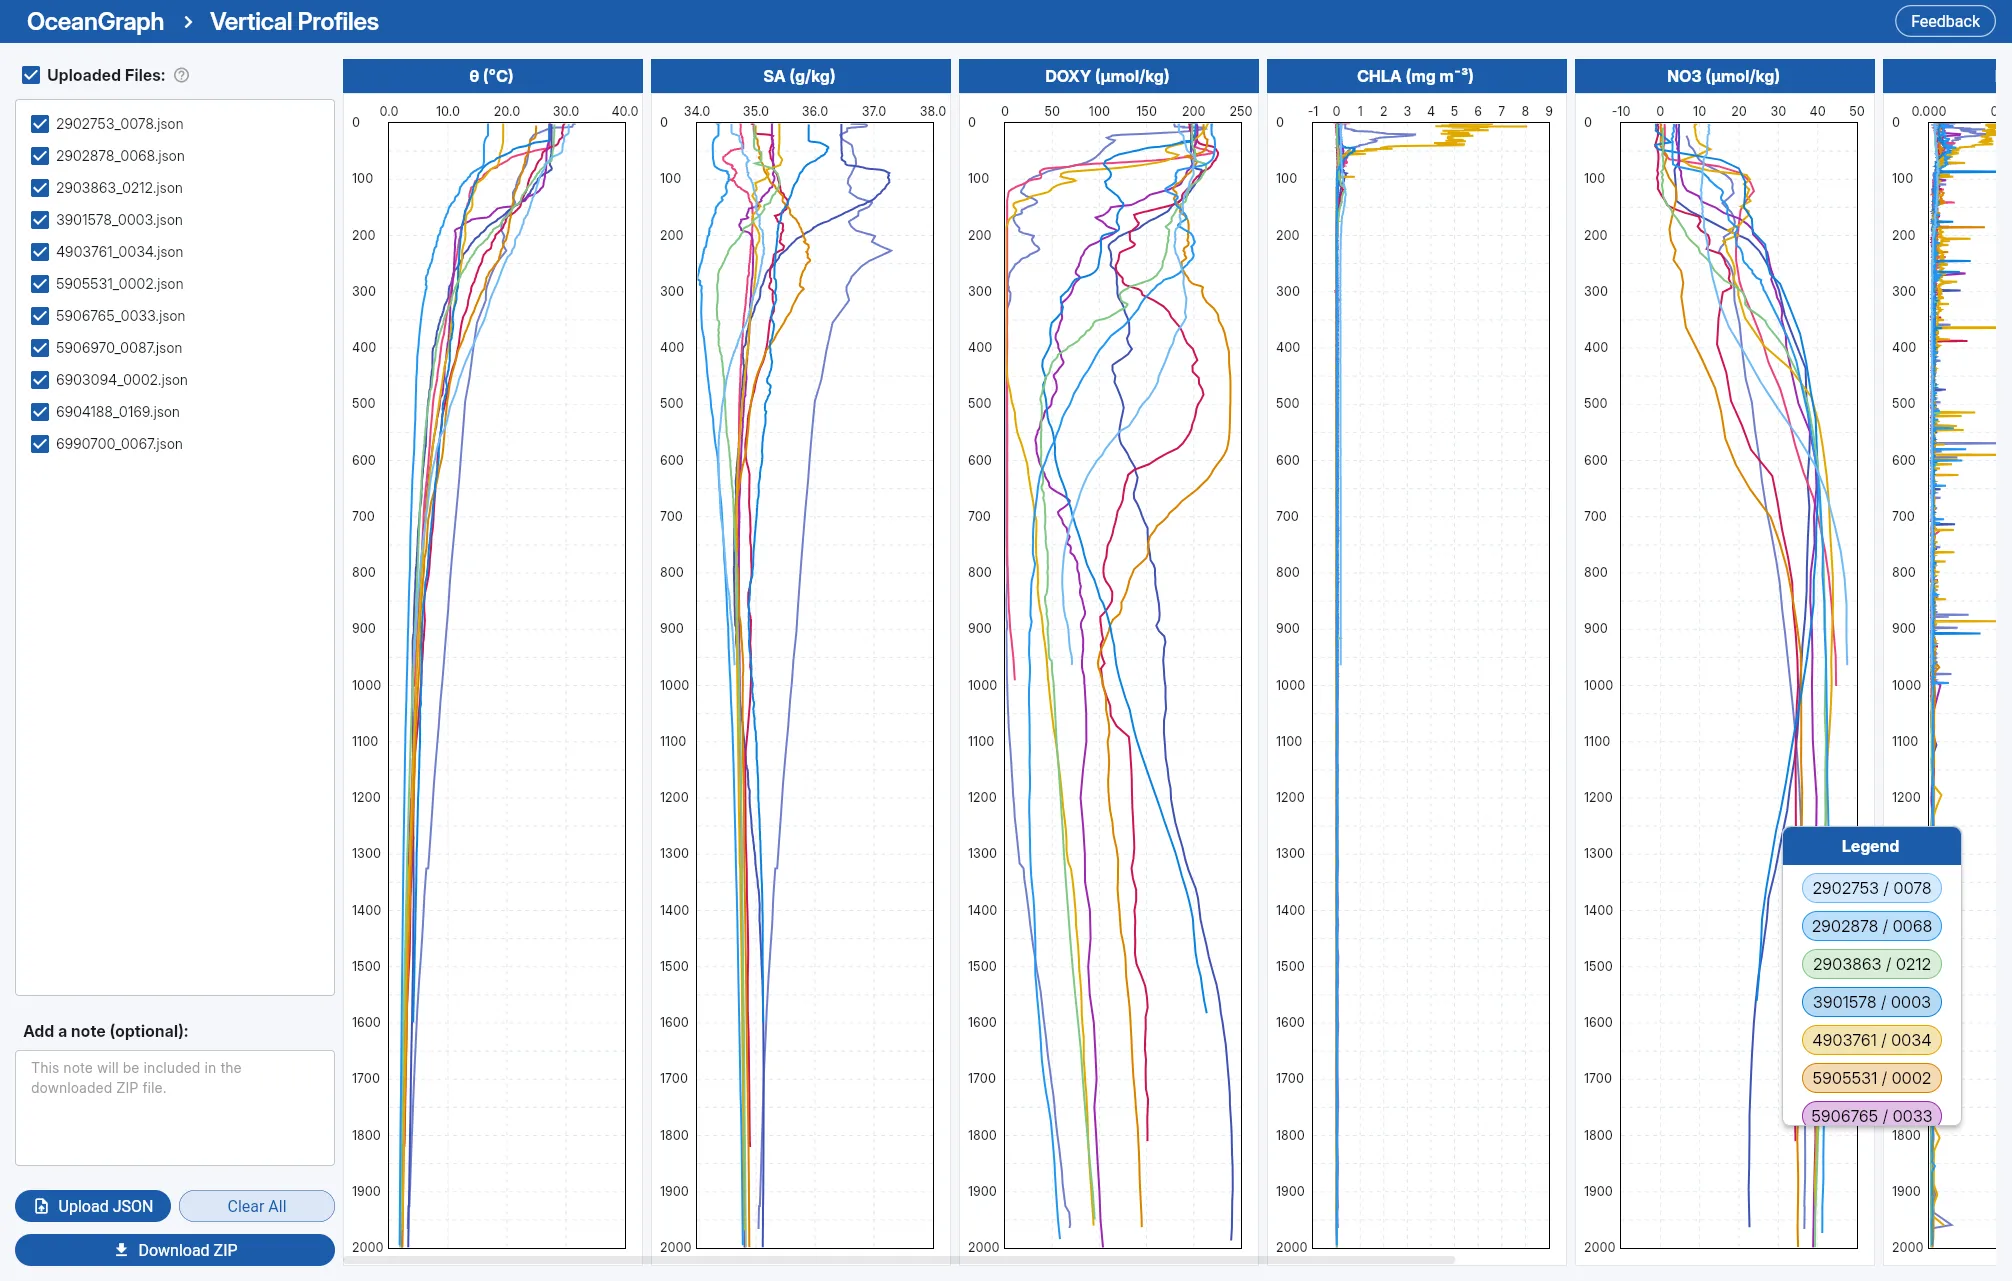
OceanGraph supports this kind of workflow with:
Good follow-up pages after this article are: