On this page
Temperature and salinity profiles are fundamental because they show how the ocean changes with depth. They help you recognize surface layers, stratification, slowly varying deep properties, and water-mass structure.
If you want the broader data context first, read How to Read Argo Float Data for Beginners (What to Look at First).
If the idea of ocean layers is new, How Does the Ocean Change With Depth? starts with the water column itself before introducing profile-reading terminology.
Why Temperature and Salinity Profiles Matter
Ocean structure is vertical as well as horizontal.
A sea-surface temperature map can tell you where warm or cool water exists at the top of the ocean, but it cannot show:
- Whether that structure extends downward
- Whether the upper ocean is well mixed or strongly layered
- Whether fresh and salty layers align with temperature changes
- Whether two regions with similar surface conditions are actually very different below
Vertical profiles answer those questions.
Why Sea Surface Temperature Is Not Enough to Measure Ocean Warming applies that distinction to ocean heat.
Profiles are especially useful for:
- Recognizing candidate mixed layers and stratification
- Comparing seasonal or regional structure
- Interpreting water masses
- Understanding why a T-S diagram looks the way it does
- Screening profiles before deeper analysis
What a Vertical Profile Shows
A vertical profile plots one variable against pressure or depth.
In practice, you usually read the profile from top to bottom:
- The upper part represents the near-surface ocean
- The lower part represents deeper water
- The line shape shows how the variable changes through the water column
The most important beginner lesson is this: the shape matters more than one value.
When you read a profile, do not ask only:
- What is the surface temperature?
- What is the salinity at 500 meters?
Also ask:
- Is the upper layer uniform or strongly changing?
- Where does the strongest gradient occur?
- Do the deeper values vary slowly or show additional transitions?
- Do temperature and salinity change together or differently?
How to Read a Temperature Profile
Temperature is often the easiest profile to interpret first because the warm-cold dimension is intuitive.
Surface layer
Start at the top of the profile.
Ask:
- Is the surface relatively warm or cool?
- Does the upper layer stay nearly constant for some depth range?
- Is there a shallow or deep thermally uniform layer that may be mixed?
A nearly uniform upper-temperature layer is consistent with active mixing. A warm surface cap above cooler water often contributes to stable density stratification. Neither conclusion is definitive from temperature alone; salinity and a density-based criterion are needed where temperature and salinity effects compensate.
Thermocline
Below the surface layer, many profiles show a zone where temperature changes rapidly with depth. This is the thermocline.
When the thermocline is sharp and shallow, it often supports stable density stratification and reduced vertical exchange. A salinity gradient can reinforce or compensate for its density effect. A weak or deep thermocline may reflect mixing, season, region, or the water masses present.
Deep water structure
Deeper in the ocean, temperature often changes more slowly than in the upper layers.
This deep part of the profile helps you judge whether:
- The lower water-column properties vary slowly over the sampled range
- There are deeper transitions or intrusions
- Two profiles differ mainly near the surface or throughout the whole water column
How to Read a Salinity Profile
Surface freshening and evaporation effects
Near the surface, salinity reflects processes such as:
- Rainfall
- River input
- Ice melt
- Evaporation
This means surface salinity can look very different even when temperature is similar. A fresher surface layer and a saltier surface layer imply different forcing and different density consequences.
Halocline
A strong vertical salinity gradient is often called a halocline.
Like the thermocline, the halocline marks a transition zone. It can indicate:
- Stable stratification when fresher, lighter water overlies saltier, denser water
- Separation between surface and subsurface water types
- Fresh or salty layers that may not be obvious from temperature alone
The direction matters: saltier water over fresher water can oppose static stability, and temperature may reinforce or compensate for either case. When temperature and salinity both show strong gradients at similar depths, the water column has a clear property transition, but density should be calculated before calling it strongly stratified.
Salinity maxima and minima
Some profiles contain a notable salinity maximum or minimum below the surface.
These features are useful because they can suggest:
- A distinct subsurface water type
- The presence of water with a specific formation history
- Structure that is easy to miss if you inspect temperature only
This is one reason salinity profiles are so important in water-mass interpretation. They often reveal structure that would otherwise stay hidden behind a simple warm-cold view.
Reading Temperature and Salinity Together
The most useful interpretation happens when you read the two profiles together.
That is because:
- At a given pressure, density depends on both temperature and salinity; in-situ density also depends on pressure
- Two profiles with similar temperature can still have very different salinity structure
- A surface layer may look simple in temperature but more complex in salinity
- A water-mass transition often becomes clearer when both variables are compared
A practical beginner workflow is:
- Read the temperature profile first.
- Read the salinity profile second.
- Ask where they change together and where they do not.
- Use a θ-S or T-S view if you need a more diagnostic interpretation.
This article pairs well with T-S Diagrams in Oceanography Explained (With Examples), because the T-S view is often the next step after you understand the vertical profiles.
Example 1: A Strongly Stratified Profile
Imagine a profile with:
- Warm surface water
- A sharp thermocline in the upper ocean
- Slightly fresher surface water
- Saltier subsurface water below
Because both the warm, fresh surface water and the cooler, saltier subsurface water favor lighter water above denser water in this example, the structure supports a layered, stably stratified upper ocean.
What you would notice:
- The surface layer is strongly separated from the water below
- Temperature changes rapidly over a relatively small depth range
- Salinity adds another layer of structure instead of simply repeating the temperature pattern
In practice, this is the kind of profile where a follow-up θ-S diagram is especially useful, because it helps you see whether the layers correspond to distinct water-property combinations.
Example 2: A Mixed Surface Layer
Now imagine a profile with:
- Nearly uniform temperature in the upper ocean
- Nearly uniform salinity over the same depth range
- A deeper transition below that mixed layer
This is consistent with a mixed surface layer produced by wind, buoyancy loss, or other recent forcing.
The important interpretation is not just that the surface values are similar. It is that the upper water column behaves as one layer for some depth range.
Check the deeper structure as well: it may differ between profiles even when the upper layer looks similar.
Example 3: Comparing Two Profiles From Different Places or Seasons
Comparisons are where profile reading becomes much more powerful.
Suppose you compare two profiles:
- One from late summer
- One from winter
You may find:
- The summer profile has a warmer, shallower stratified surface layer
- The winter profile has a deeper mixed layer and weaker surface gradient
- Deep values are relatively similar between the two
That kind of comparison immediately tells you where variability is concentrated. It also helps separate seasonal upper-ocean change from more persistent deep structure.
The same logic applies to regional comparisons:
- Coastal vs offshore
- Subtropical vs subpolar
- One float cycle vs the next
For consecutive float cycles, remember that the platform drifts. Their difference combines temporal evolution with any geographic change along the trajectory.
For a regional example, Kuroshio and Oyashio Below the Surface shows how a subtropical-subpolar contrast can appear in temperature, salinity, and oxygen profiles.
For a question-first introduction to the seasonal comparison, see How Deep Do Ocean Seasons Reach?.
A Better First Step: Compare Profiles Before You Write Code
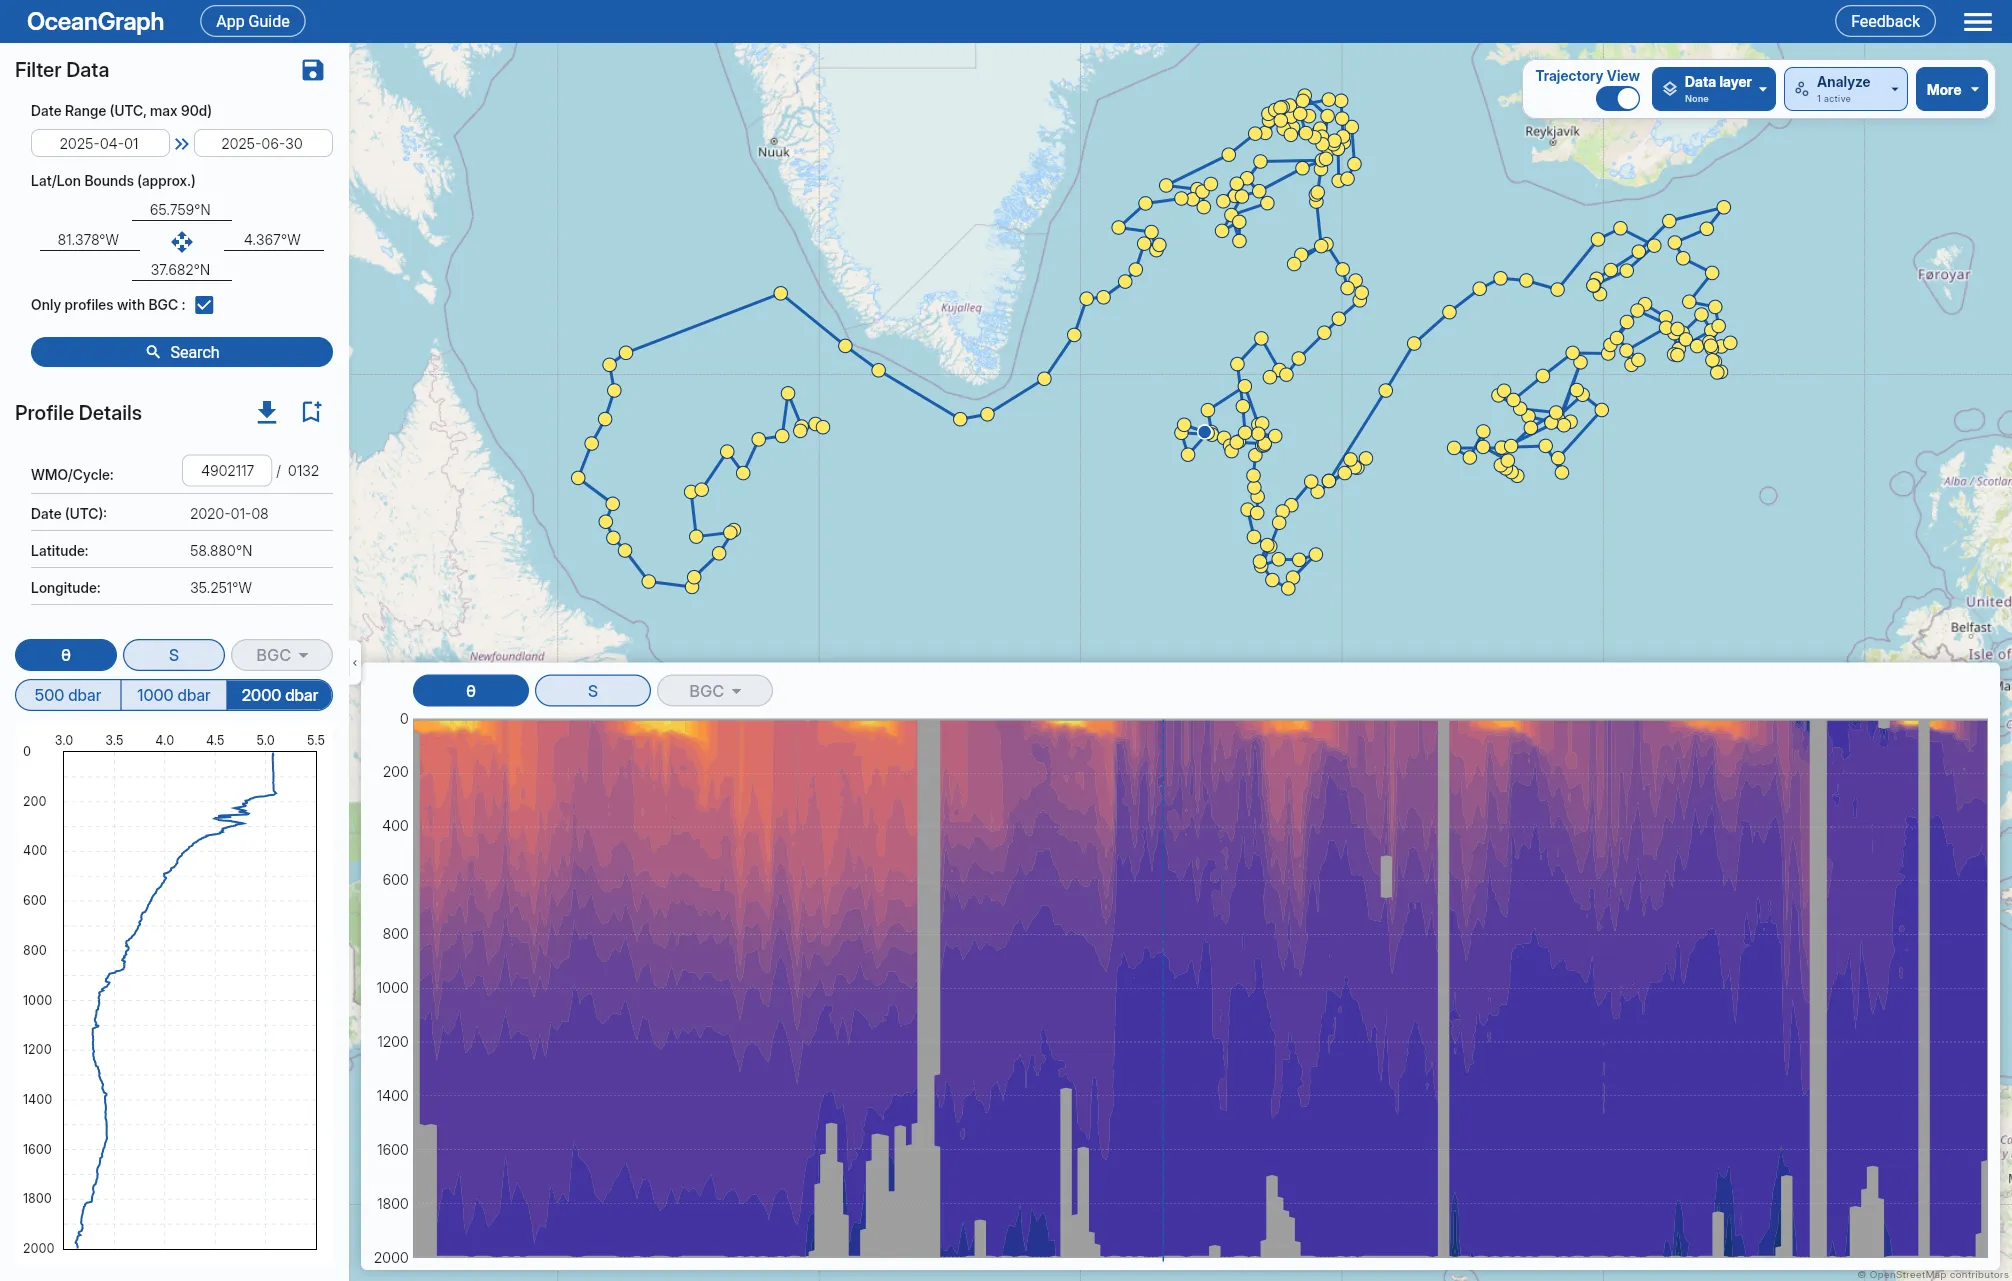
With OceanGraph, you can:
- Search profiles by region, date, and WMO ID
- Keep the observation context visible
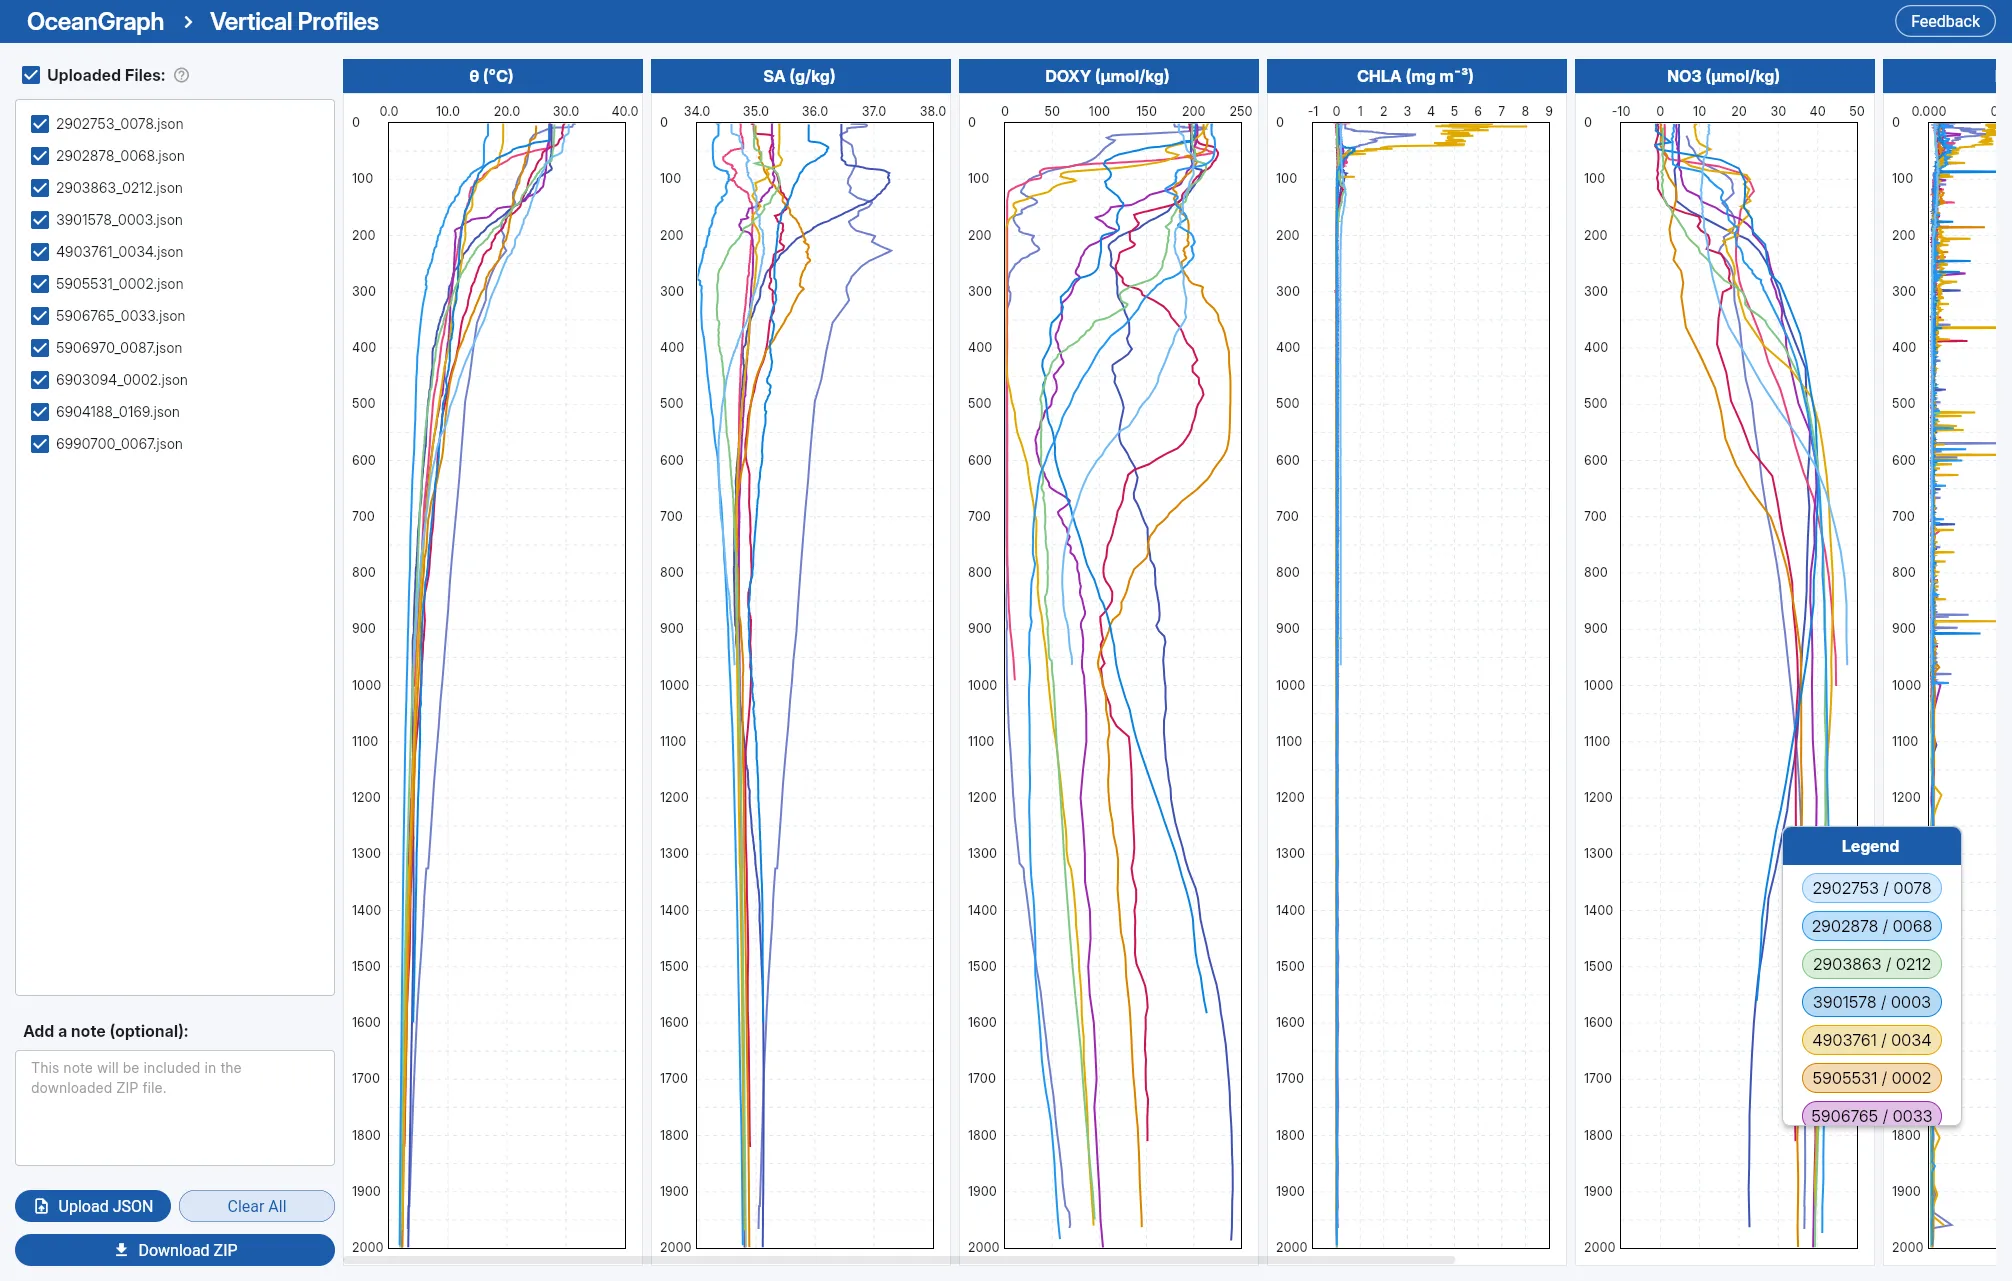
- Open vertical profiles directly
- Compare temperature and salinity structure visually
- Move to a θ-S interpretation when needed
Useful follow-up pages are:
- Search and Bookmark
- Analysis Lab: Vertical Profiles (JSON upload)
- How to Read Argo Float Data for Beginners (What to Look at First)
- T-S Diagrams in Oceanography Explained (With Examples)
Frequently Asked Questions
Is pressure the same as depth in these profiles?
Not exactly, but for qualitative interpretation it is usually fine to think of higher pressure as deeper water. For a quantitative depth in meters, use a latitude-aware pressure-to-height conversion rather than treating decibars as exact meters.