On this page
Seawater density depends on temperature, salinity, and pressure. At the same pressure, colder or saltier water is generally denser, so the combination of temperature and salinity influences stratification and mixing.
If you want the profile-reading foundation first, see Ocean Temperature and Salinity Profiles Explained.
What Salinity and Temperature Each Tell You
Temperature often reflects:
- Surface heating and cooling
- Seasonal changes
- Vertical stratification
- Contact with deeper or shallower water
Salinity often reflects:
- Evaporation
- Rainfall
- River input
- Ice melt or sea-ice formation
- Mixing between different water types
That means the two variables respond to overlapping but not identical processes.
When you read them together, you get a more complete view of what shaped the water column.
How They Affect Seawater Density
One of the main reasons salinity and temperature are often discussed together is density.
At the same pressure, in broad terms:
- Colder water is usually denser than warmer water
- Saltier water is usually denser than fresher water
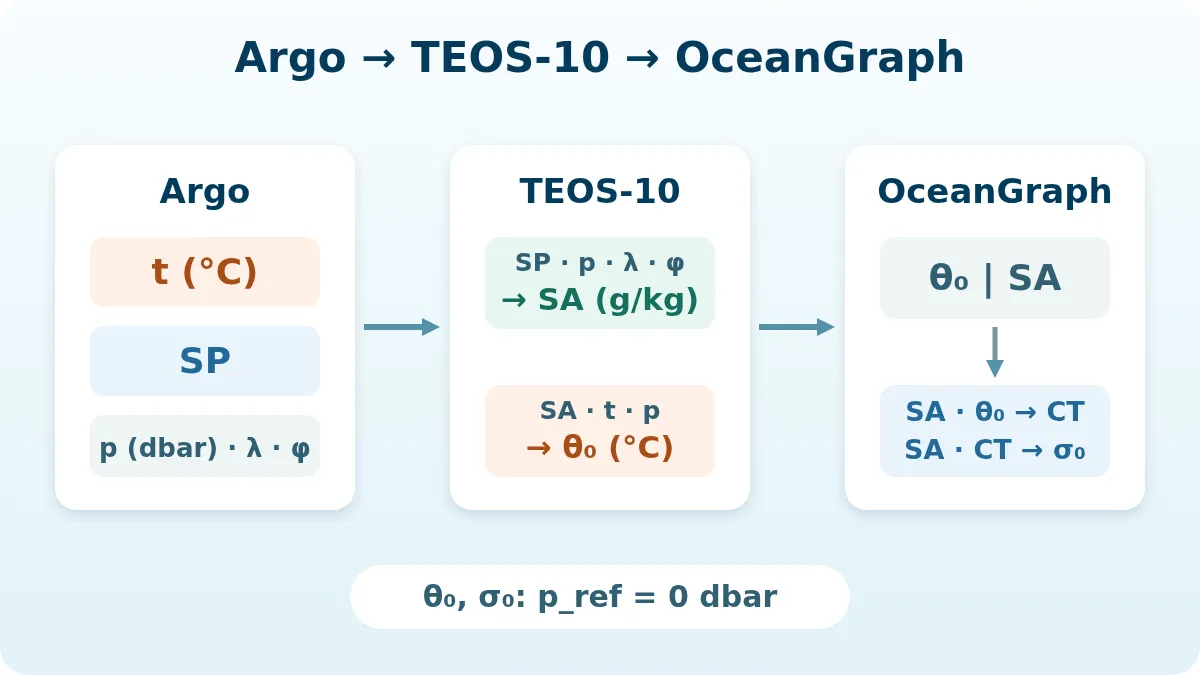
In-situ density also changes with pressure. For comparisons of water parcels or vertical stability, oceanographers therefore use a stated thermodynamic convention and reference pressure, such as TEOS-10 potential density. Density influences:
- Vertical layering
- Mixing
- Stratification
- The identity of water masses
In practical interpretation, this means you should not ask only whether a layer is warm or cold. You should also ask whether its salinity reinforces or offsets that temperature effect.
For example:
- Warm water can still be relatively dense if it is salty enough
- Cool water can be relatively light if it is fresh enough
That is why a T-S or θ-S diagram is often such a useful next step after reading vertical profiles.
The Relationship Is Not a Single Rule
Many beginners expect a simple relationship such as:
- warmer means fresher
- colder means saltier
The real ocean is more complicated.
Sometimes temperature and salinity move together. Sometimes they move in opposite directions. The pattern depends on the physical process involved.
Here are a few common cases.
Surface heating
If the ocean surface is heated strongly, the upper layer often becomes warmer. But heating by itself does not automatically change salinity.
So the result may be:
- Warmer surface water
- Little salinity change at first
If the warm surface is also separated from the water below, stratification may increase.
Evaporation
Evaporation removes water and leaves salt behind, increasing surface salinity. In sunny subtropical regions, solar heating and evaporation can produce surface water that is both warm and relatively salty.
Rainfall or river input
Freshwater input lowers salinity.
That often leads to:
- Fresher surface water
- A stronger salinity gradient with depth
If rainfall occurs in a warm region, the surface may be warm and fresh. In that case, temperature and salinity tell different parts of the story.
Cooling and winter mixing
Surface cooling can make the upper ocean denser. If the resulting buoyancy loss is sufficient to erode the existing density stratification, convection and a deeper mixed layer can develop.
This can produce:
- Cooler surface water
- A deeper mixed layer
- More vertically uniform temperature and sometimes salinity
Mixing between water types
Sometimes the most important relationship is not local forcing at the surface but mixing between different water masses.
Then the observed salinity-temperature pattern may reflect:
- Warm salty water mixing with cooler fresher water
- Surface-modified water mixing with deeper water
- Regional water-mass contrasts
This is where T-S space becomes especially useful.
Common Ocean Patterns
Some temperature-salinity combinations recur in regions with similar conditions.
A regional example is the contrast between subtropical and subpolar waters east of Japan. Kuroshio and Oyashio Below the Surface shows how temperature, salinity, and oxygen add different evidence to that comparison.
Warm and fresh surface water
This may occur where heating is strong but freshwater input is also important.
Possible causes include:
- Rainfall
- Runoff
- Ice melt
The water may look warm in temperature alone, but salinity reveals that the surface layer is also distinct in composition.
Warm and salty surface water
This is common in regions where evaporation is strong.
Here, temperature and salinity can both contribute to a distinct surface water type, though their effects on density work in opposite directions.
Cool and fresh water
This pattern often appears in higher latitudes or where freshwater input is large.
It can indicate:
- Surface cooling
- Meltwater influence
- Strong seasonal or regional contrasts
Cool and salty water
This can appear where cooling and salt addition both matter, or where deeper waters have different formation histories than the surface.
It often points toward denser water and a different dynamical role in the water column.
Example 1: Same Temperature, Different Salinity
Imagine two near-surface samples with similar temperature but different salinity.
If you looked at temperature alone, you might think they represent similar conditions. But if one sample is much fresher, the interpretation changes immediately.
That difference may suggest:
- Rainfall or runoff influence in one case
- Different regional water masses
- Different density structure even at the same temperature
This is a simple example of why the relationship between salinity and temperature matters more than either variable by itself.
Example 2: Same Salinity, Different Temperature
Now imagine two waters with similar salinity but clearly different temperature.
That may reflect:
- Seasonal heating or cooling
- Different depths within the same region
- Different atmospheric conditions over time
Again, looking at one variable alone would compress a physically meaningful difference into something that looks too simple.
Why Vertical Profiles Matter First
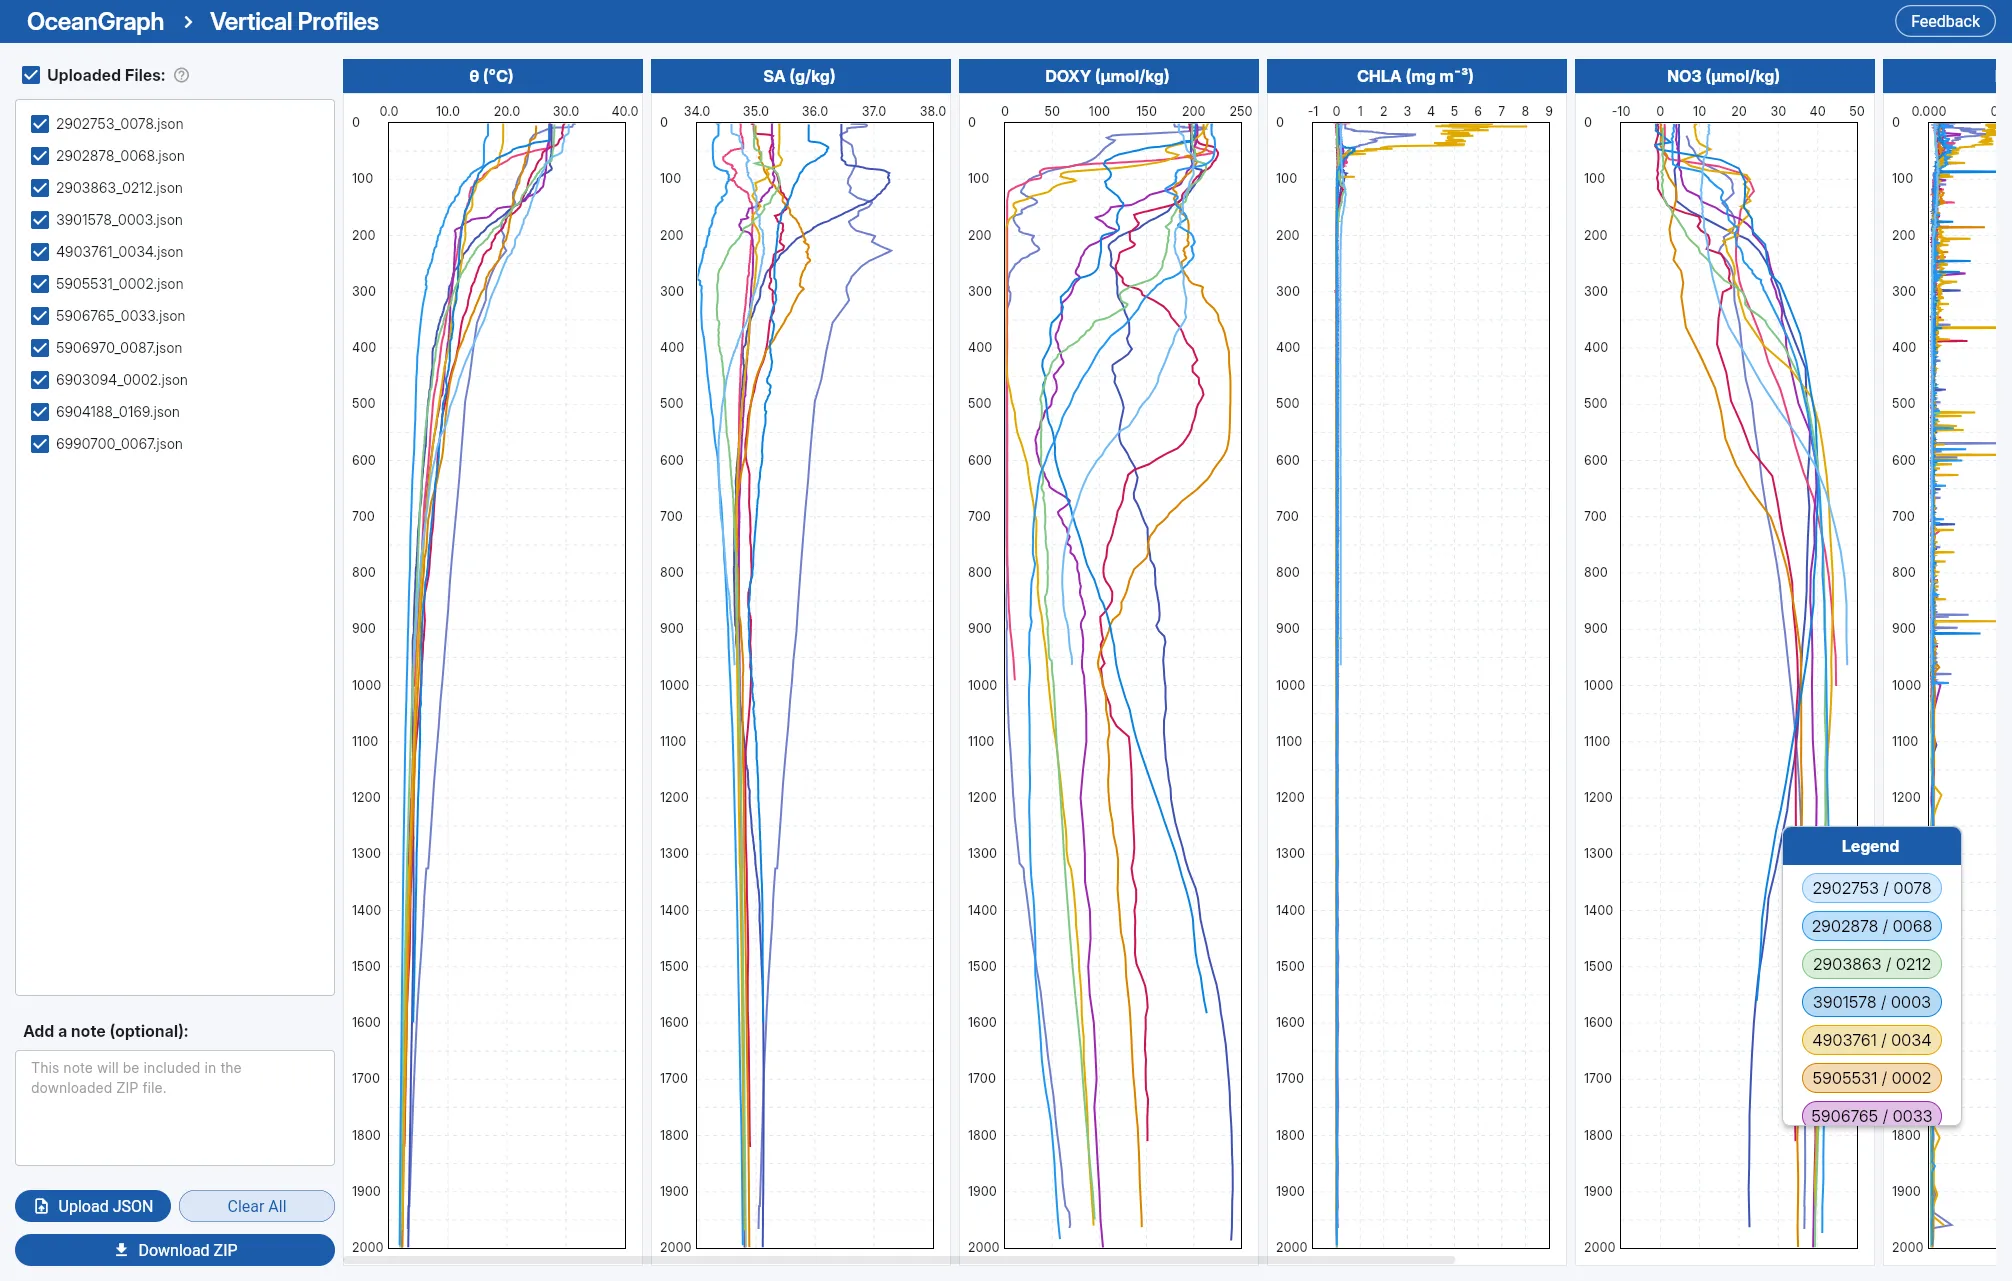
For most beginners, the easiest way to understand this relationship is to start in profile space.
A vertical profile shows:
- Where the warm or cool water sits
- Where fresher or saltier layers appear
- Whether the main gradients occur at similar depths
- Whether deeper properties vary slowly or show additional changes
This helps answer the first practical question: where in the water column are the important differences?
OceanGraph’s guide for this workflow is here:
Why a T-S Diagram Makes the Relationship Clearer
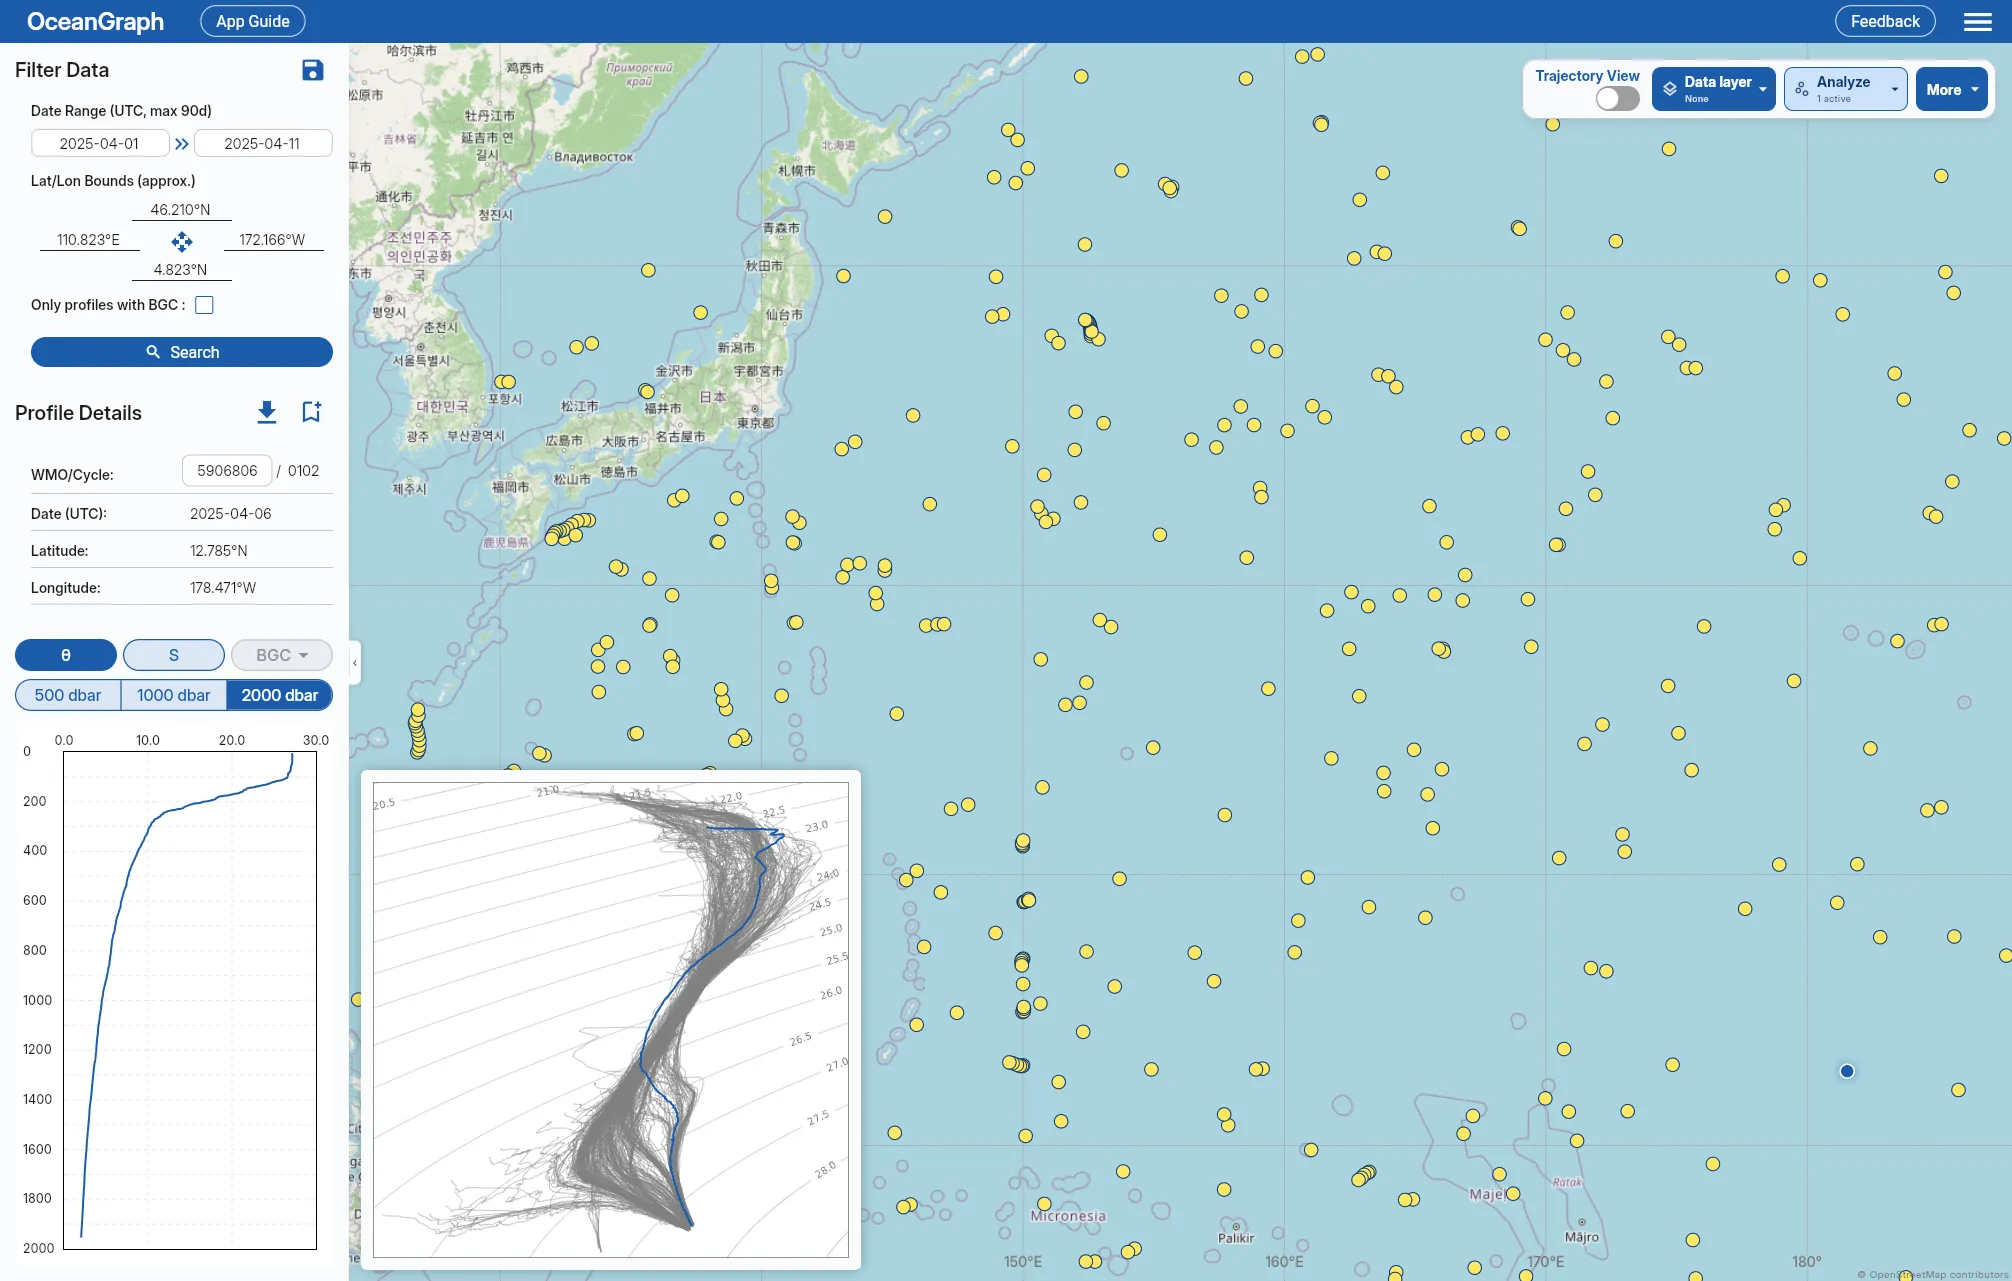
Once you understand the vertical profiles, the next step is often a T-S diagram or θ-S diagram.
That view is useful because it shows:
- Which temperature-salinity combinations occur together
- Whether the water column forms a smooth curve or distinct clusters
- Whether the structure suggests mixing between end-members
- How temperature and salinity combine in a way that relates to density
This is where many learners finally see why the relationship matters.
Instead of reading temperature and salinity as two separate lines, you read them as one connected water-property structure.
OceanGraph’s feature guide is here:
A Better First Step: Compare Real Examples Before Coding
Before writing code, it helps to compare several real profiles and then open a θ-S view of the same data.
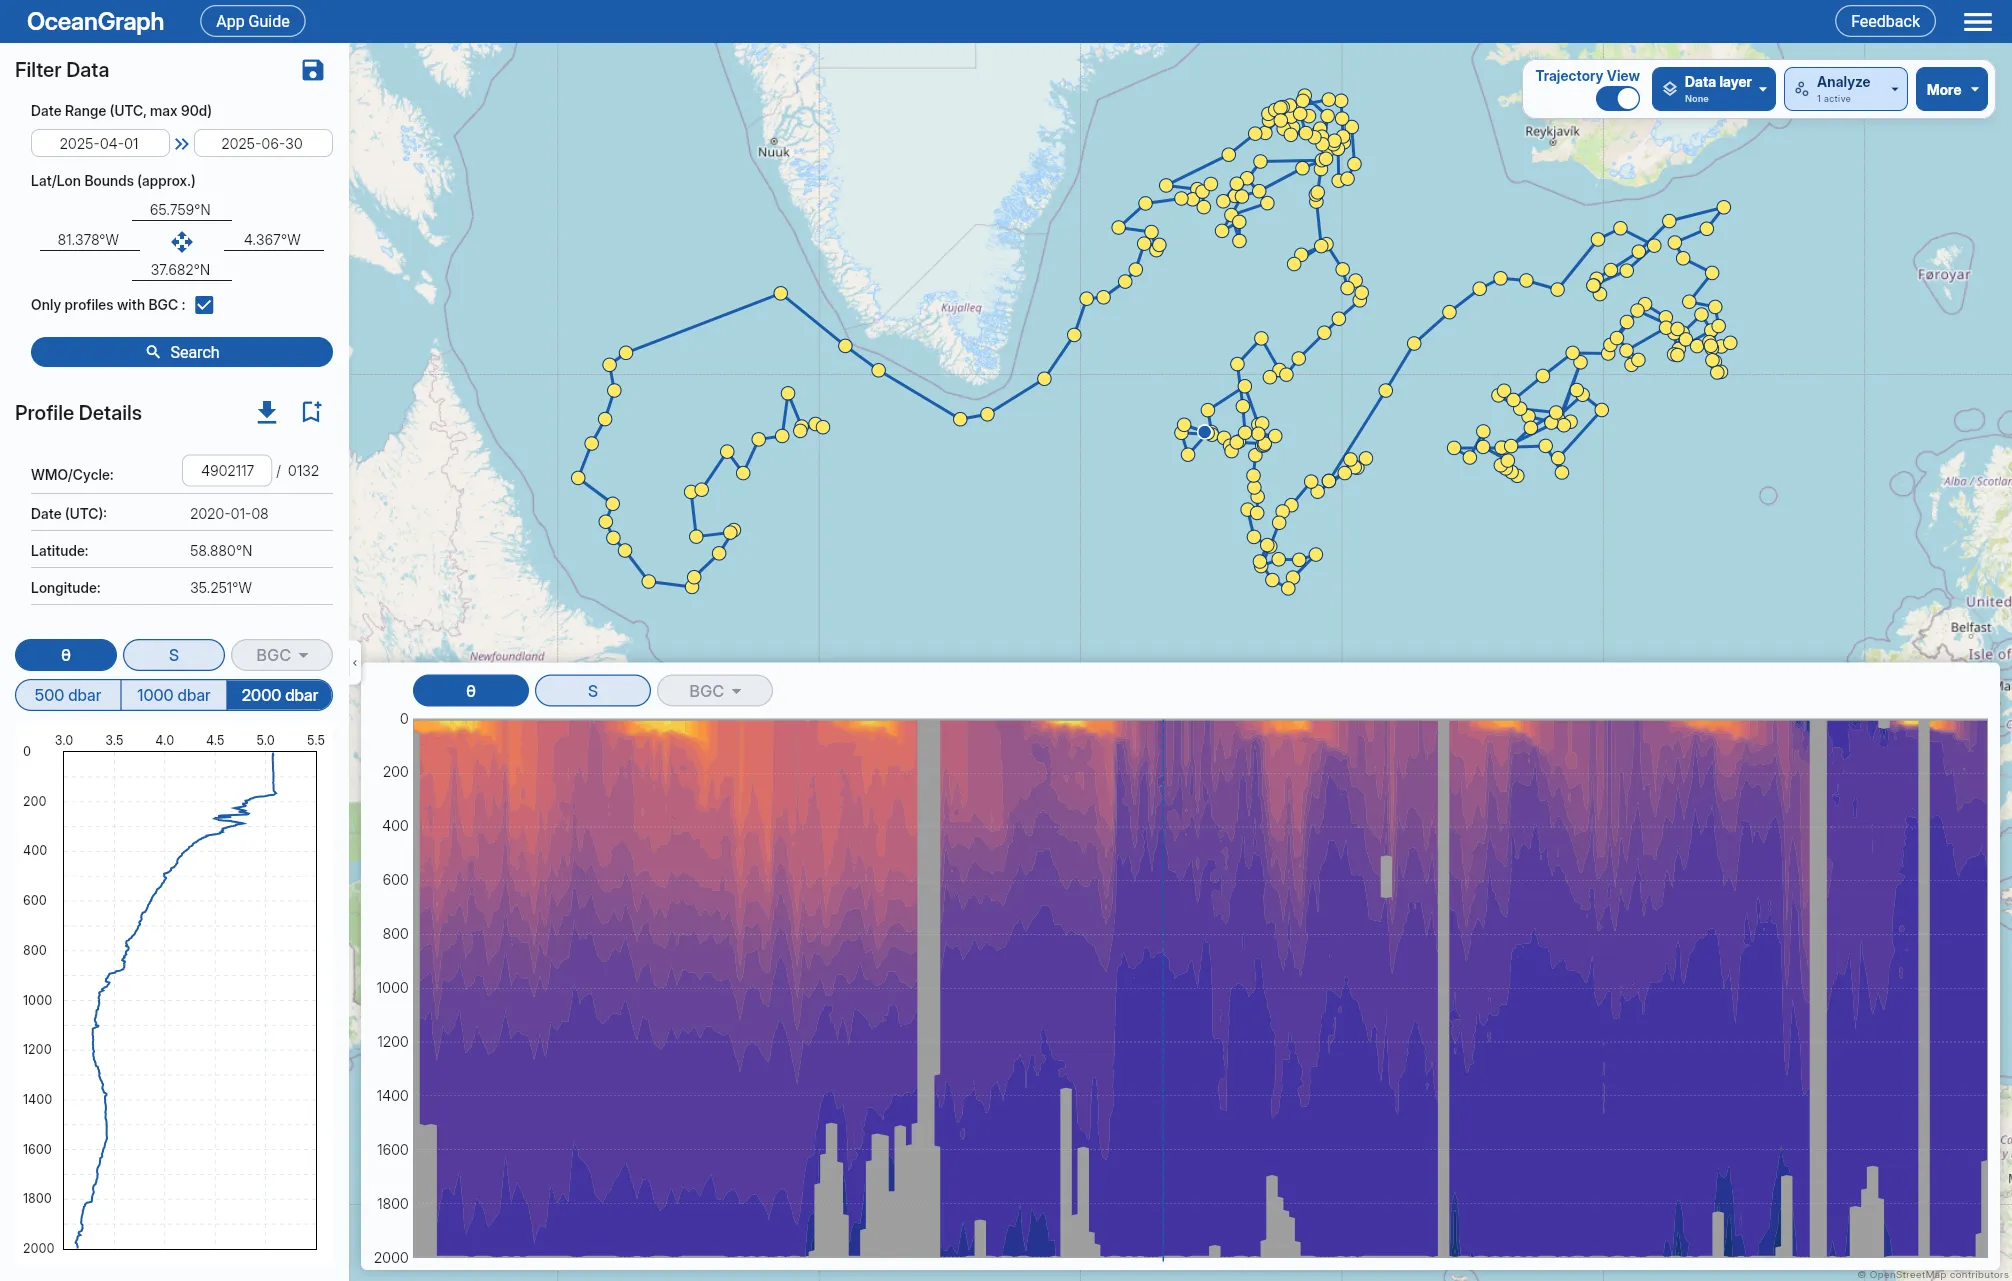
OceanGraph is useful here because it lets you:
- Search real Argo profiles by region and time
- Compare temperature and salinity structure in the water column
- Move directly to θ-S space for the same observations
- Build intuition from multiple examples instead of one isolated figure
Useful follow-up pages are: