On this page
An Argo profile may store in-situ temperature and Practical Salinity, while an oceanographic chart displays potential temperature and Absolute Salinity. The names are similar, but the quantities are not interchangeable.
The distinction matters whenever you compare values, label axes, calculate density, or read a temperature-salinity diagram. Potential temperature puts samples observed at different pressures onto a common pressure reference. Absolute Salinity is the TEOS-10 salinity variable, expressed in g/kg and constructed to represent composition effects on density; for Reference Composition seawater, it corresponds to dissolved-material mass fraction. Together, these quantities offer a more consistent basis for comparing water properties.
The Four Quantities at a Glance
| Quantity | What it represents | Symbol used here | Unit or scale |
|---|---|---|---|
| In-situ temperature | Temperature at the pressure where the sensor measured it | t | °C |
| Practical Salinity | A conductivity-based salinity value defined by PSS-78 | SP | Dimensionless |
| Potential temperature | Temperature seawater would have after an isentropic, constant-salinity move to a reference pressure | θ | °C |
| Absolute Salinity | TEOS-10 salinity variable consistent with density; for Reference Composition seawater, it corresponds to dissolved-material mass fraction | SA | g/kg |
The formal symbols are t for in-situ temperature, S with a subscript P for Practical Salinity, and S with a subscript A for Absolute Salinity. This article renders the latter two as SP and SA in plain text. These are scientific symbols, not Argo NetCDF variable names: Argo stores in-situ temperature as TEMP and Practical Salinity as PSAL.
Two differences organize the whole topic:
- In-situ temperature and Practical Salinity begin with measurements made by the CTD.
- Potential temperature and Absolute Salinity are derived quantities calculated from those observations and supporting information.
If profile plots are new to you, read Ocean Temperature and Salinity Profiles Explained first. It introduces the vertical shapes that these variables describe.
What Is In-Situ Temperature?
In-situ temperature is the temperature of seawater at the place and pressure of observation. In an Argo float, a conductivity-temperature-depth instrument measures temperature and pressure while conductivity is used to determine salinity. The Argo program’s float overview describes this measurement cycle.
This is the appropriate temperature when the question is explicitly about the water at its observed pressure. The complication is that temperature can change when a parcel moves vertically even if it exchanges no heat or salt with its surroundings. A deep and a shallow sample therefore cannot always be compared as though pressure played no role.
That is why physical oceanography often uses a reference-pressure temperature for vertical comparisons.
What Is Potential Temperature?
Potential temperature is the temperature a seawater parcel would have if it were moved to a chosen reference pressure while keeping its entropy and salinity constant. OceanGraph uses a reference pressure of 0 dbar, commonly written as θ or θ₀.
This is a hypothetical thermodynamic transformation. As a useful first approximation, it can be described as removing the warming effect of compression. The calculation is not a fixed correction subtracted from in-situ temperature, however: it follows an isentropic path to the reference pressure, with the TEOS-10 equation of state determining the result.
Potential temperature is useful because every sample is expressed at the same pressure reference. Differences down a profile then describe water-property differences without also comparing temperatures evaluated at different pressures.
Near 0 dbar, in-situ and potential temperature referenced to 0 dbar are nearly the same. Their difference generally becomes more relevant as observation pressure increases. The exact difference depends on temperature, salinity, and pressure.
What Is Practical Salinity?
Practical Salinity is inferred from electrical conductivity, temperature, and pressure according to the Practical Salinity Scale 1978, or PSS-78. It is written as SP and is formally dimensionless.
Practical Salinity is extremely valuable: it is reproducible, closely tied to what oceanographic instruments measure, and remains the salinity variable archived in many observational products. But it is a conductivity ratio, not a direct statement that a kilogram of seawater contains a specified number of grams of dissolved material.
You will still see “PSU” attached to Practical Salinity in older plots and informal descriptions. Under the formal definition, however, SP has no unit. Always check the variable name and metadata instead of identifying a salinity type from a familiar numerical range alone.
What Is Absolute Salinity?
Absolute Salinity is the salinity variable used in TEOS-10 thermodynamic calculations and is expressed in grams per kilogram (g/kg). It is constructed to be consistent with seawater density. For Reference Composition seawater, SA corresponds to the mass fraction of dissolved material.
The conversion is not just a universal multiplication of Practical Salinity. Seawater composition varies slightly between regions, and equal conductivity does not guarantee exactly equal dissolved mass or thermodynamic properties. The TEOS-10 conversion used for open-ocean data therefore combines:
- Practical Salinity
- Pressure
- Longitude
- Latitude
The result includes an estimate of regional composition effects based on global data. Where composition differs from the Reference Composition, this density-consistent estimate need not equal a literal weighing of every dissolved substance.
The official TEOS-10 introduction explains why Absolute Salinity replaced Practical Salinity as the salinity argument for the thermodynamic equation of state. The GSW Oceanographic Toolbox documentation lists the conversion functions used in practice.
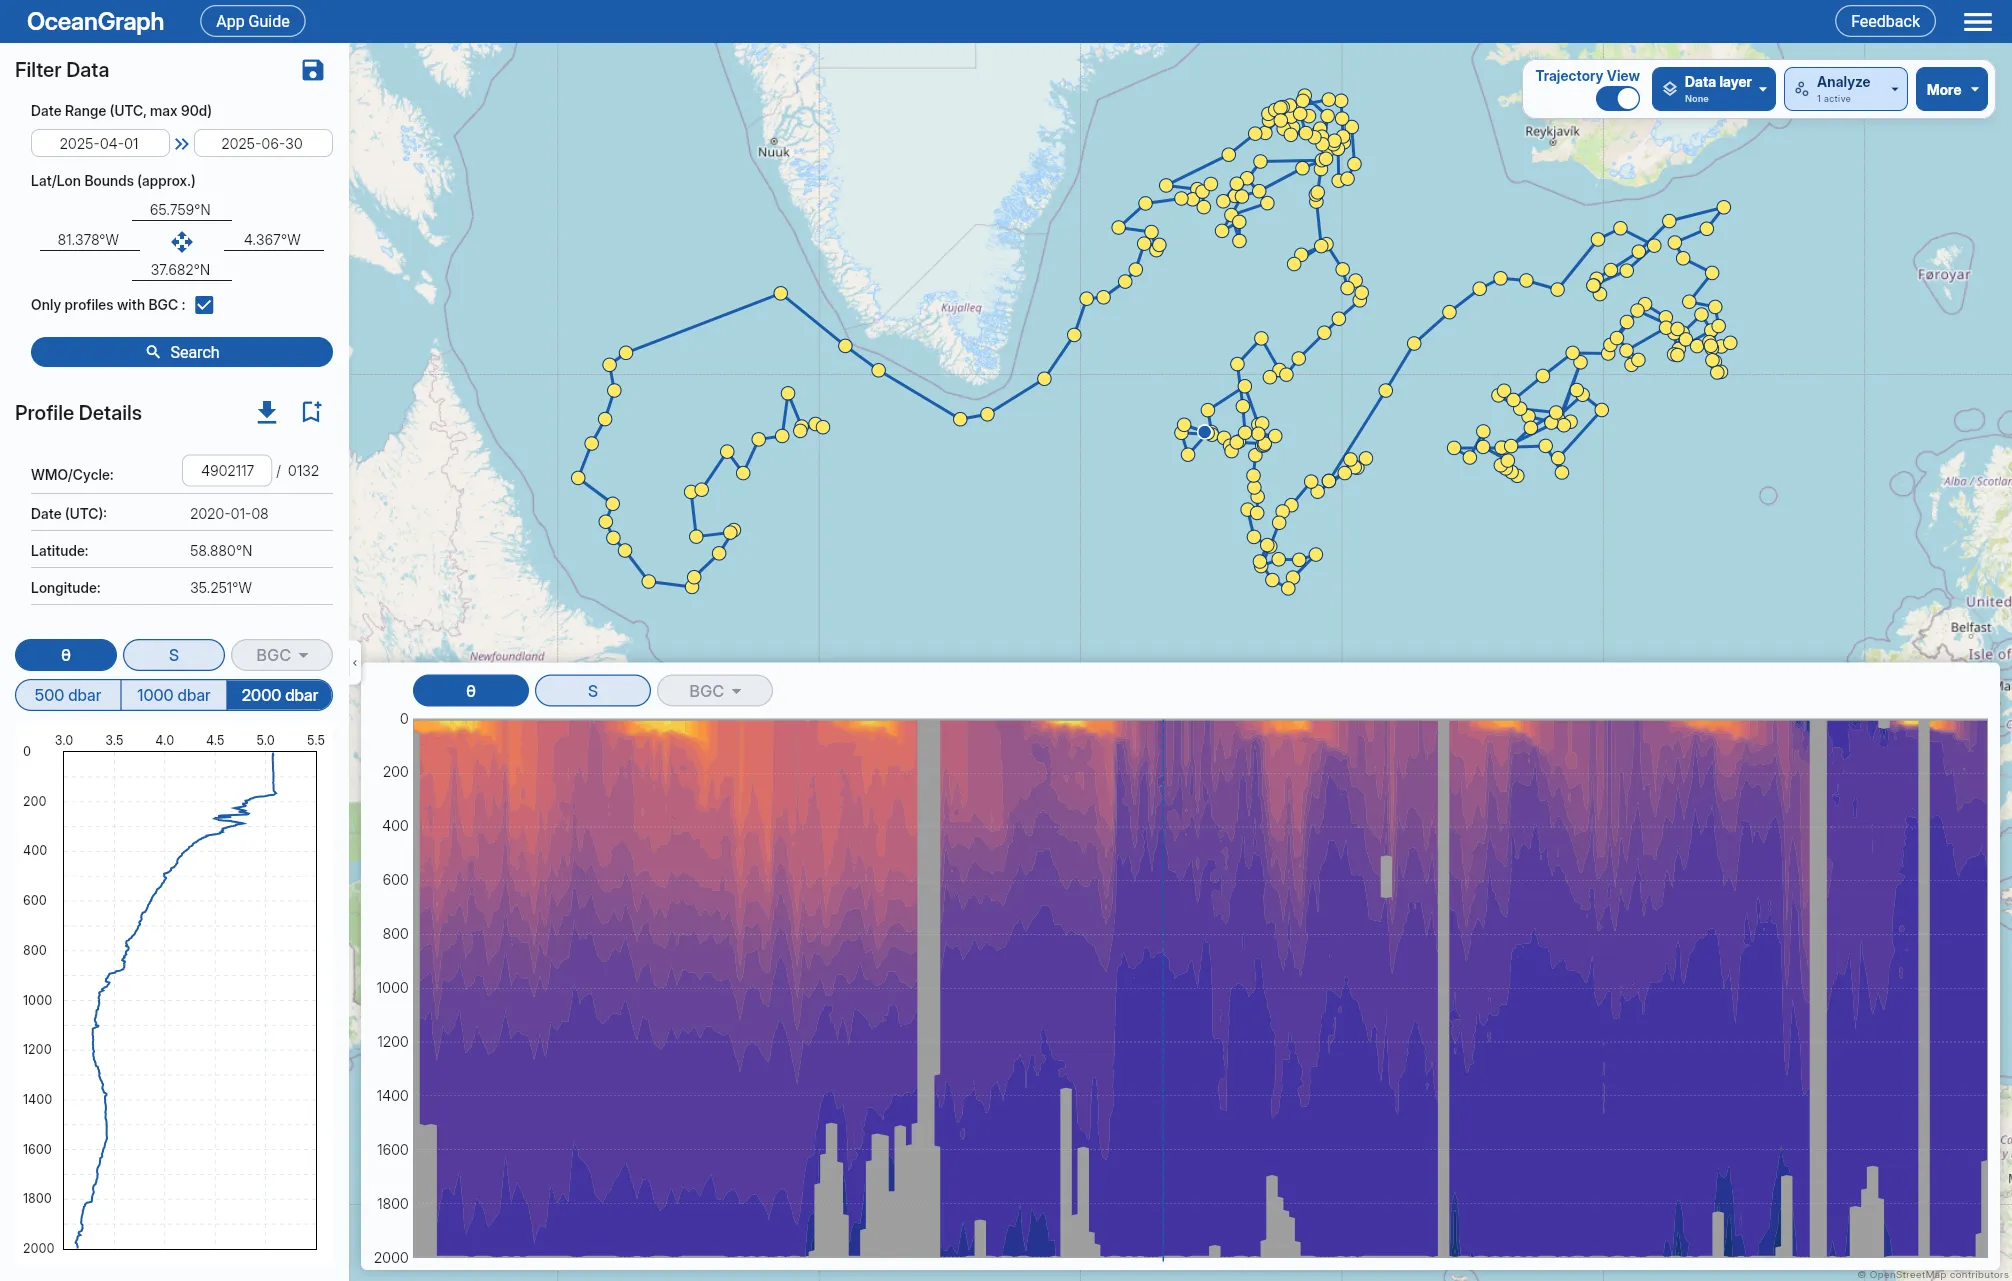
How OceanGraph Converts an Argo Profile
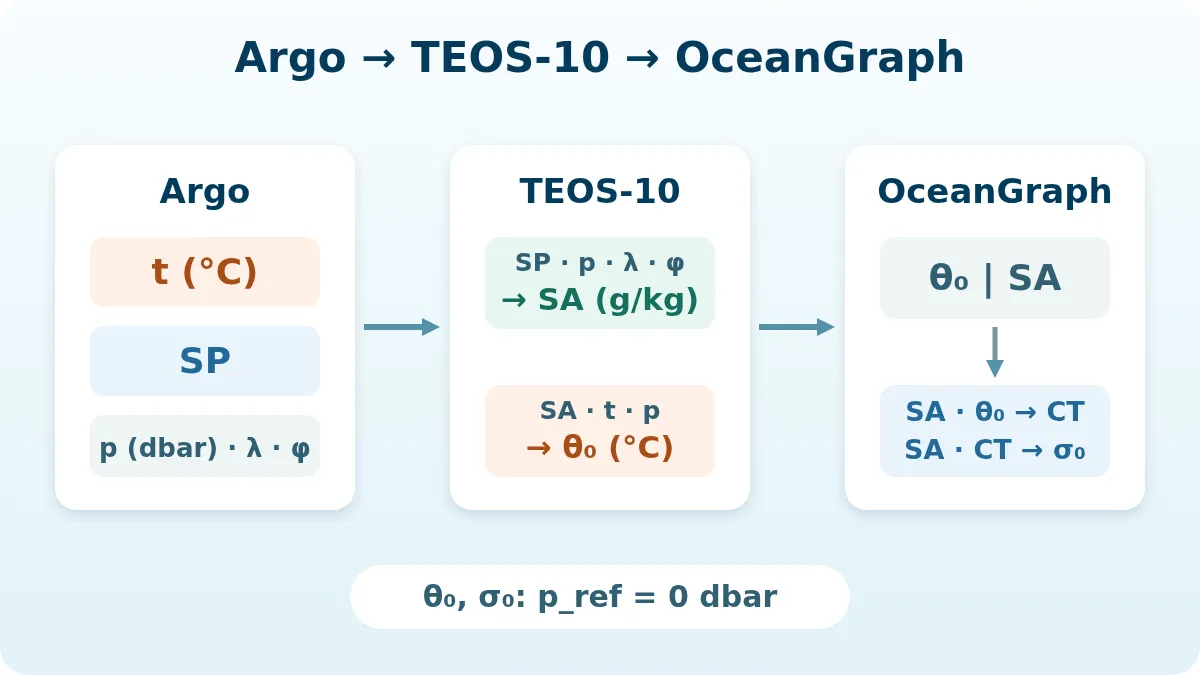
OceanGraph calculates its displayed properties in the following order:
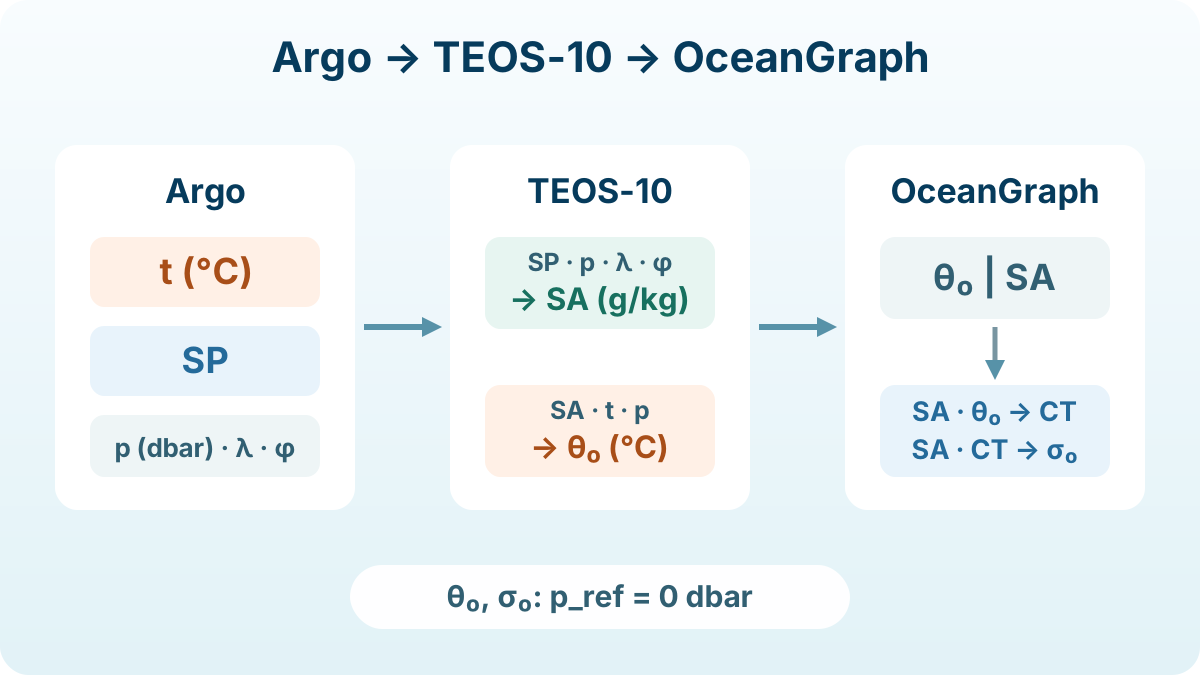
- It selects quality-controlled in-situ temperature, Practical Salinity, and pressure values from the profile, using eligible adjusted data where available.
- It calculates Absolute Salinity from Practical Salinity, pressure, longitude, and latitude with SA_from_SP.
- It calculates potential temperature referenced to 0 dbar from Absolute Salinity, in-situ temperature, and pressure with pt_from_t.
- It stores and displays the resulting potential temperature and Absolute Salinity.
For the background density field on the θ-S diagram, there is one more step. OceanGraph passes Absolute Salinity and potential temperature to CT_from_pt to calculate Conservative Temperature (CT), then passes Absolute Salinity and CT to sigma0 to calculate potential density anomaly referenced to 0 dbar (σ₀).
This intermediate CT calculation supplies the variables required by the density equation. OceanGraph calculates CT only for the background density contours; it does not convert the displayed profile values, so the vertical axis remains potential temperature and the horizontal axis remains Absolute Salinity.
Potential Temperature Is Not Conservative Temperature
TEOS-10 recommends Conservative Temperature for many calculations involving heat content and turbulent mixing. Potential temperature and Conservative Temperature are close in much of the ocean, but they are distinct variables with different thermodynamic definitions.
That distinction creates three common diagram types:
- An in-situ T-SP diagram
- A traditional θ-S diagram, whose salinity scale must be checked
- A TEOS-10 SA-CT diagram
OceanGraph displays θ against SA. The TEOS-10 Manual provides the detailed definitions and explains why CT and SA are the preferred pair for the current thermodynamic standard.
For guidance on reading curve shapes, density contours, and water-property signatures, continue with T-S Diagrams in Oceanography Explained.
Why the Choice of Variables Changes Interpretation
Comparing samples from different pressures
Potential temperature places samples on one reference pressure. That makes a vertical or regional comparison more meaningful than comparing in-situ temperatures without accounting for pressure.
Calculating density
The equation of state must receive the variables it expects. Passing Practical Salinity where Absolute Salinity is required, or potential temperature where Conservative Temperature is required, produces a calculation with mismatched inputs even if the numbers look plausible.
Comparing datasets and figures
Two salinity axes centered around similar values may use SP and SA. Two temperature axes may use t, θ, or CT. Small numerical differences can matter in quantitative work, and the labels determine what calculations are valid.
Interpreting gradients
A rapid change in θ or SA can identify property transitions in a profile. Density stratification, however, depends on their combined effect. Thermocline, Halocline, and Pycnocline: What Is the Difference? explains how the three gradients can reinforce, offset, or occur at different depths.
A Reliable Reading Workflow
When you open an Argo-based profile or diagram, use this sequence:
- Read the axis label and unit. Do not assume that “temperature” means t or that “salinity” means SP.
- Find the reference pressure. A potential temperature or potential density value is incomplete without it; OceanGraph uses 0 dbar.
- Check the data source and quality policy. Adjusted and raw Argo values have different roles, and invalid pairs should not enter a derived calculation.
- Match the equation to the variables. Use TEOS-10 functions with their documented SA, CT, θ, t, and pressure inputs.
- Retain the original observations. Derived values improve comparison, but traceability back to t, SP, pressure, position, and quality flags remains essential.
Use the corresponding Argo NetCDF file to inspect the source t, SP, and quality flags for individual measurements.
OceanGraph’s θ-S Diagram guide documents the displayed axes and density background. The data filtering policy explains how valid temperature-salinity pairs are selected before visualization.