On this page
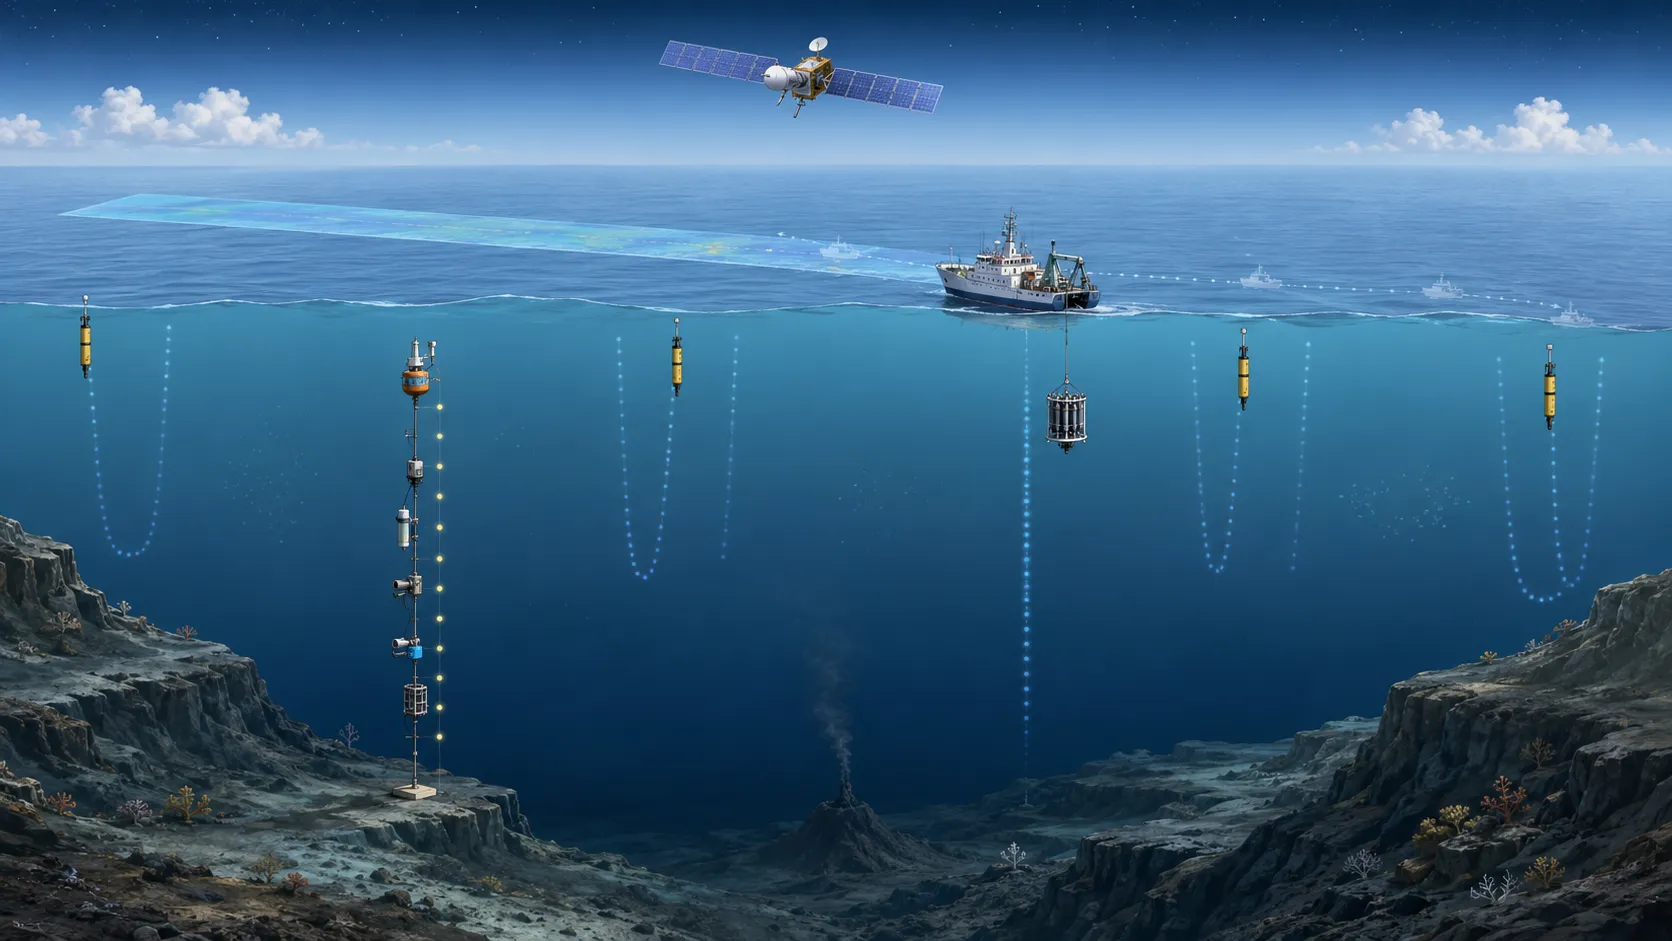
No single instrument can measure the whole ocean. Satellites cover enormous areas but mainly observe the surface. Research ships can sample from the surface to the seafloor but visit a limited number of places. Moorings watch one location closely, while Argo floats repeatedly profile broad parts of the open ocean.
Ocean observation works by combining these different views. The key distinction is whether an instrument sees the surface, a fixed location, a ship section, or a drifting vertical profile.
Four Complementary Views of the Ocean
Each system is useful because it samples a different combination of area, depth, and time.
Satellites: broad coverage of the surface
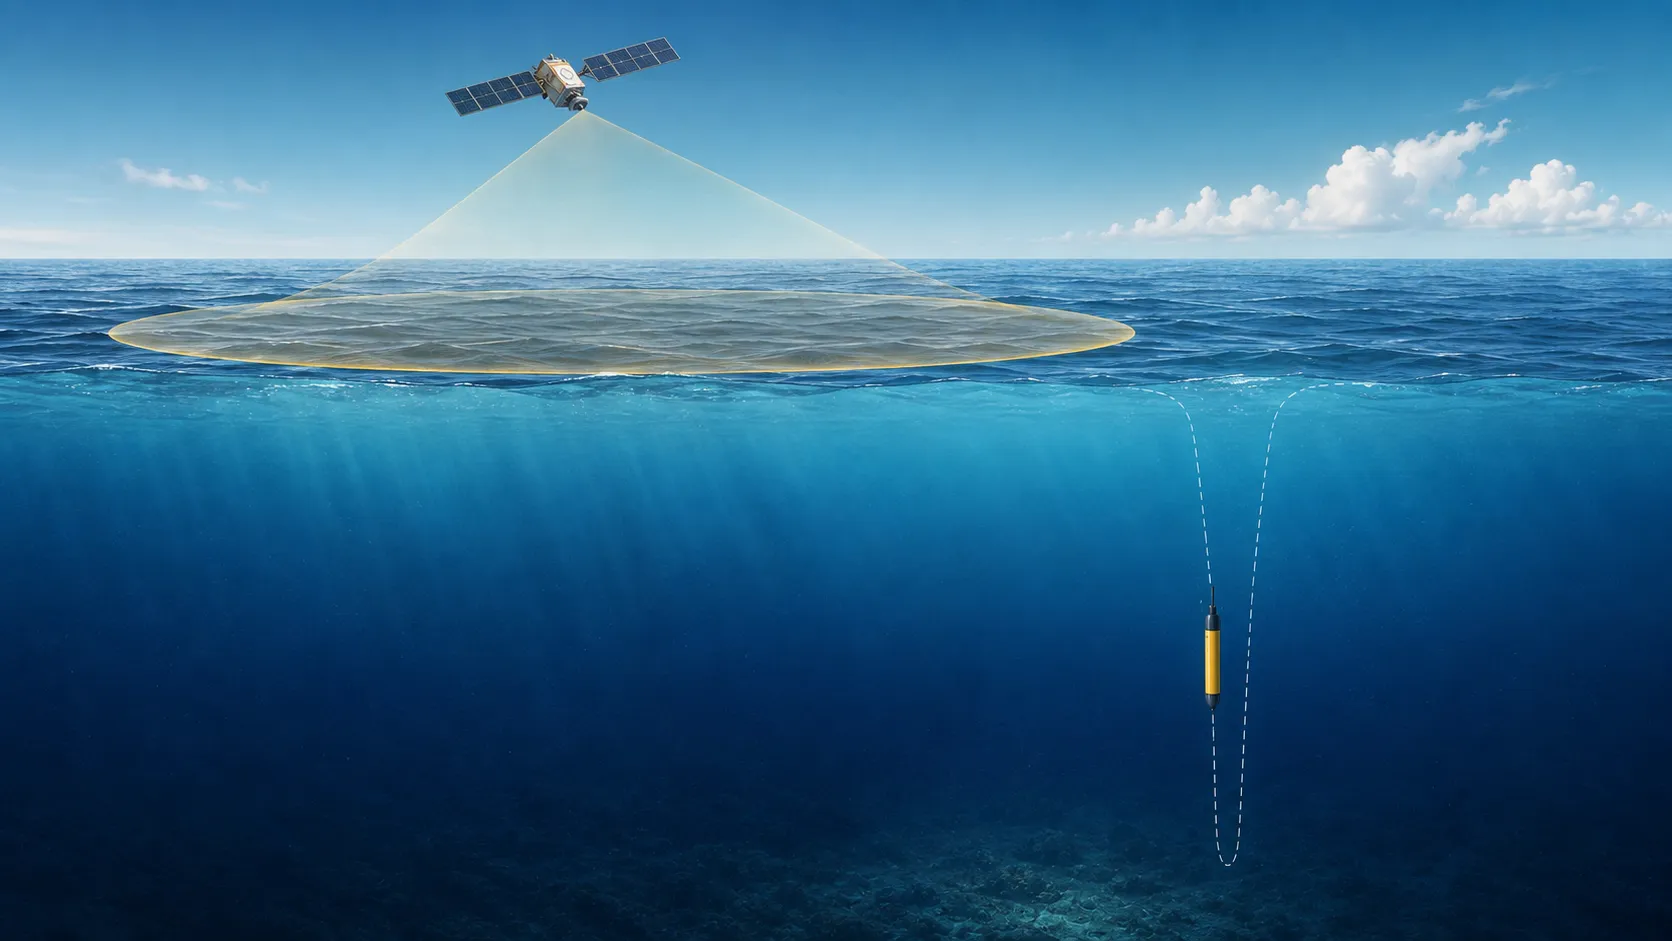
Satellites repeatedly observe large parts of the globe. Depending on the sensor and mission, they provide information about sea-surface temperature, sea-surface height, ocean color, sea ice, winds, and other surface properties.
Their strength is coverage. A satellite map can reveal a front, eddy, warm current, or basin-wide pattern that would be impossible to survey from one ship.
The limitation is equally important: most satellite measurements do not directly reveal the full water column. A warm patch at the surface does not tell you by itself how deep the warm water extends.
For a closer comparison of what satellite instruments record and what Argo measures below the surface, see What Do Ocean Satellites Measure? Why Argo Profiles Still Matter.
Research ships: detailed measurements and water samples
Ships can lower a package of sensors through the water column. A common system uses conductivity, temperature, and pressure sensors, often together with bottles that collect water at selected depths.
Ship observations can include:
- Temperature, salinity, and pressure
- Dissolved oxygen and nutrients
- Carbon-system measurements
- Currents and many specialized variables
This makes ship data detailed and versatile. Japan Meteorological Agency describes the instruments used by its oceanographic research vessels.
The tradeoff is time and cost. A ship observes along its route and schedule, so even a major expedition covers only a small fraction of the ocean.
Moorings and buoys: repeated measurements at one place
Moored instruments are anchored or maintained near a fixed location. They are valuable when the goal is to measure rapid changes through time without mixing them with changes in geographic position.
A mooring can reveal tides, storms, seasonal cycles, and long time series at one site.
Surface drifters and other autonomous platforms fill additional roles, but they should not all be treated as interchangeable with profiling floats.
Argo floats: repeated profiles across the open ocean
An Argo float changes its buoyancy to move vertically. A typical Core Argo cycle includes drifting near 1,000 meters, descending toward about 2,000 meters, and then rising while measuring pressure, temperature, and conductivity used to derive salinity. At the surface it transmits its data by satellite before beginning another cycle.
The exact mission varies, but the standard cycle is commonly about ten days. The Argo Program explains the mechanism in How do floats work?.
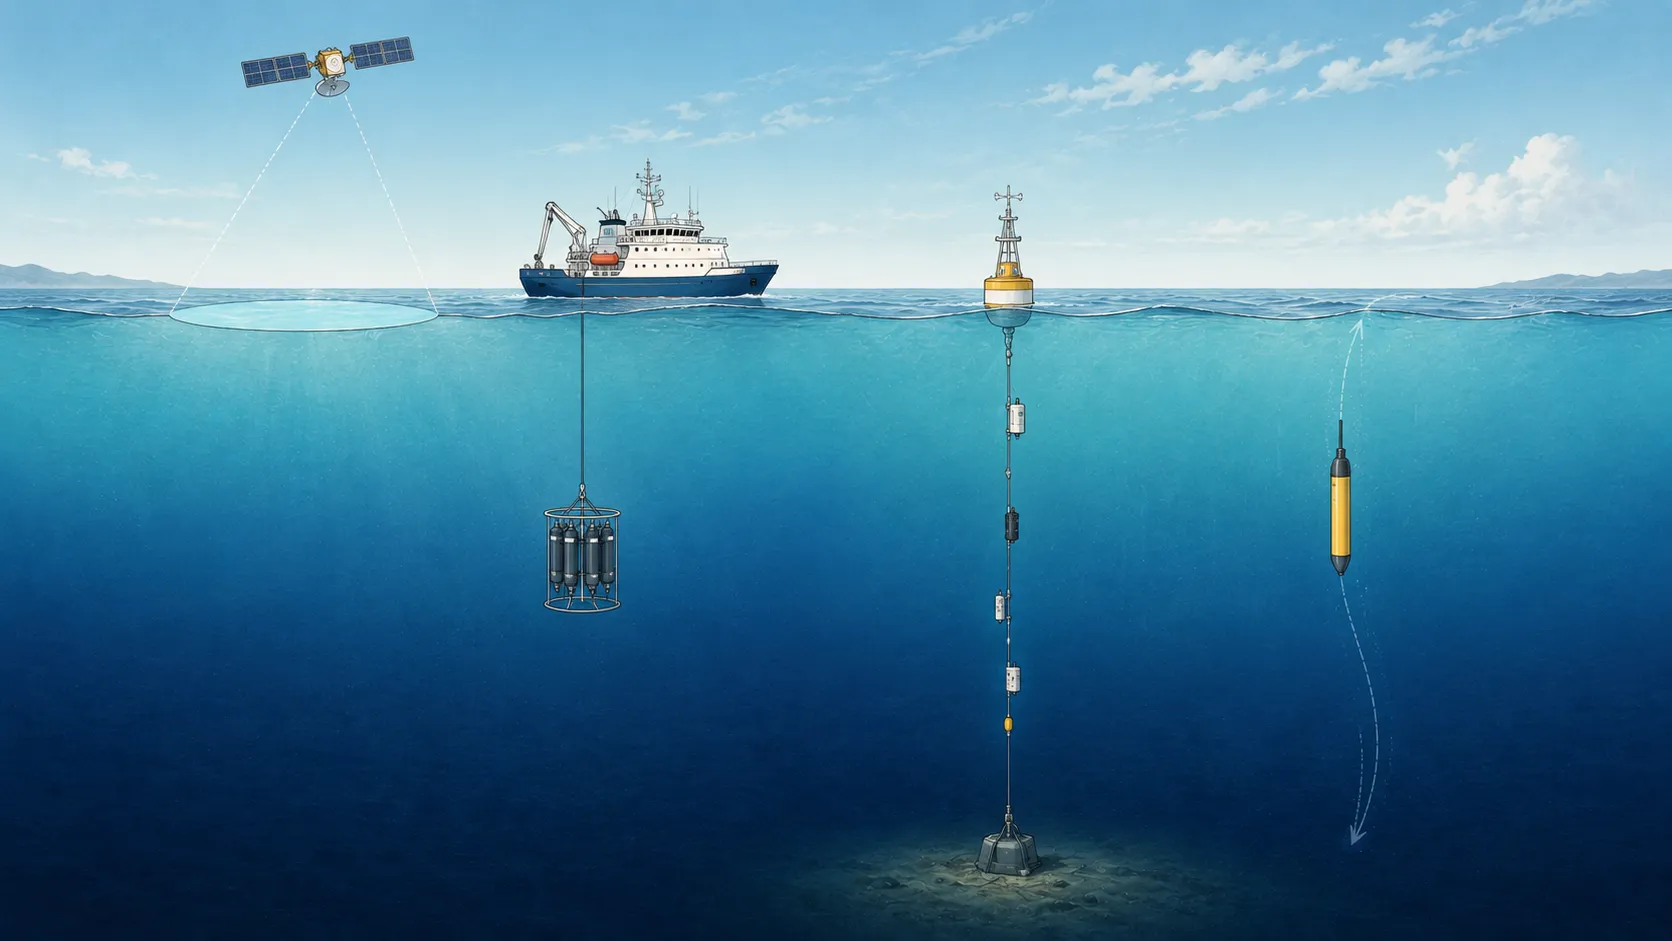
The illustration below places the four observing systems in one scene and shows the different parts of the ocean that they sample.
Why Several Systems Are Better Than One
Each observing system answers a different question.
| Question | Particularly useful view |
|---|---|
| Where is the ocean surface warm today? | Satellite sea-surface temperature map |
| What chemistry and biology are present at selected depths? | Ship station and water samples |
| How did one location change during a storm? | Mooring |
| How does temperature and salinity change from the surface to around 2,000 m across the open ocean? | Argo profiles |
Scientific analyses and data products often combine several kinds of observations with models.
For example, a satellite may show a warm region at the surface. An Argo profile can then show whether that warmth is a thin cap or a thick upper-ocean layer. A ship can return later to collect variables that the float does not measure and to calibrate or validate observing systems.
What Argo Measures—and What It Does Not
Core Argo is centered on pressure, temperature, and salinity. Some floats in BGC Argo also carry sensors for dissolved oxygen, nitrate, pH, optical backscatter, chlorophyll-related fluorescence, and light variables. Deep Argo extends observations deeper than the standard Core Argo range.
The sensors carried vary among floats. Interpret temperature-salinity features associated with mixing or water-mass boundaries alongside place, time, nearby profiles, and sometimes other observations.
The Argo Float Complete Guide explains floats, profiles, cycles, and Argo program branches in more detail.
How a Measurement Becomes a Usable Profile
Collecting a number is only the first step. Ocean observations also need:
- Time and geographic position
- Instrument metadata
- Calibration information
- Quality-control flags
- A consistent data format
Argo profiles are assembled and distributed through the Global Data Assembly Centres. OceanGraph uses this public source and applies documented filtering before presenting profiles. The Data Source and Data Filtering Policy explain that path.
From a World Map to One Water Column
OceanGraph is designed for the stage between reading about an observing system and writing a custom analysis.
A practical first exploration is:
- Search a region and date range.
- Notice how many profiles are available and where they are located.
- Select one marker and read its date, position, WMO ID, and cycle number.
- Inspect the temperature and salinity profile.
- Follow the float trajectory to see how the observing location changed.
The Search and Bookmark guide covers the controls, while Finding Argo Float Profiles by Location, Time, and WMO ID explains which search method fits different questions.
If the idea of a vertical profile is still unfamiliar, begin with How Does the Ocean Change With Depth?.
The next step is to ask where each view remains incomplete. Why Can’t We Observe the Whole Ocean? explains spatial, temporal, depth, and variable gaps, and distinguishes direct measurements from interpolation and analyzed fields.