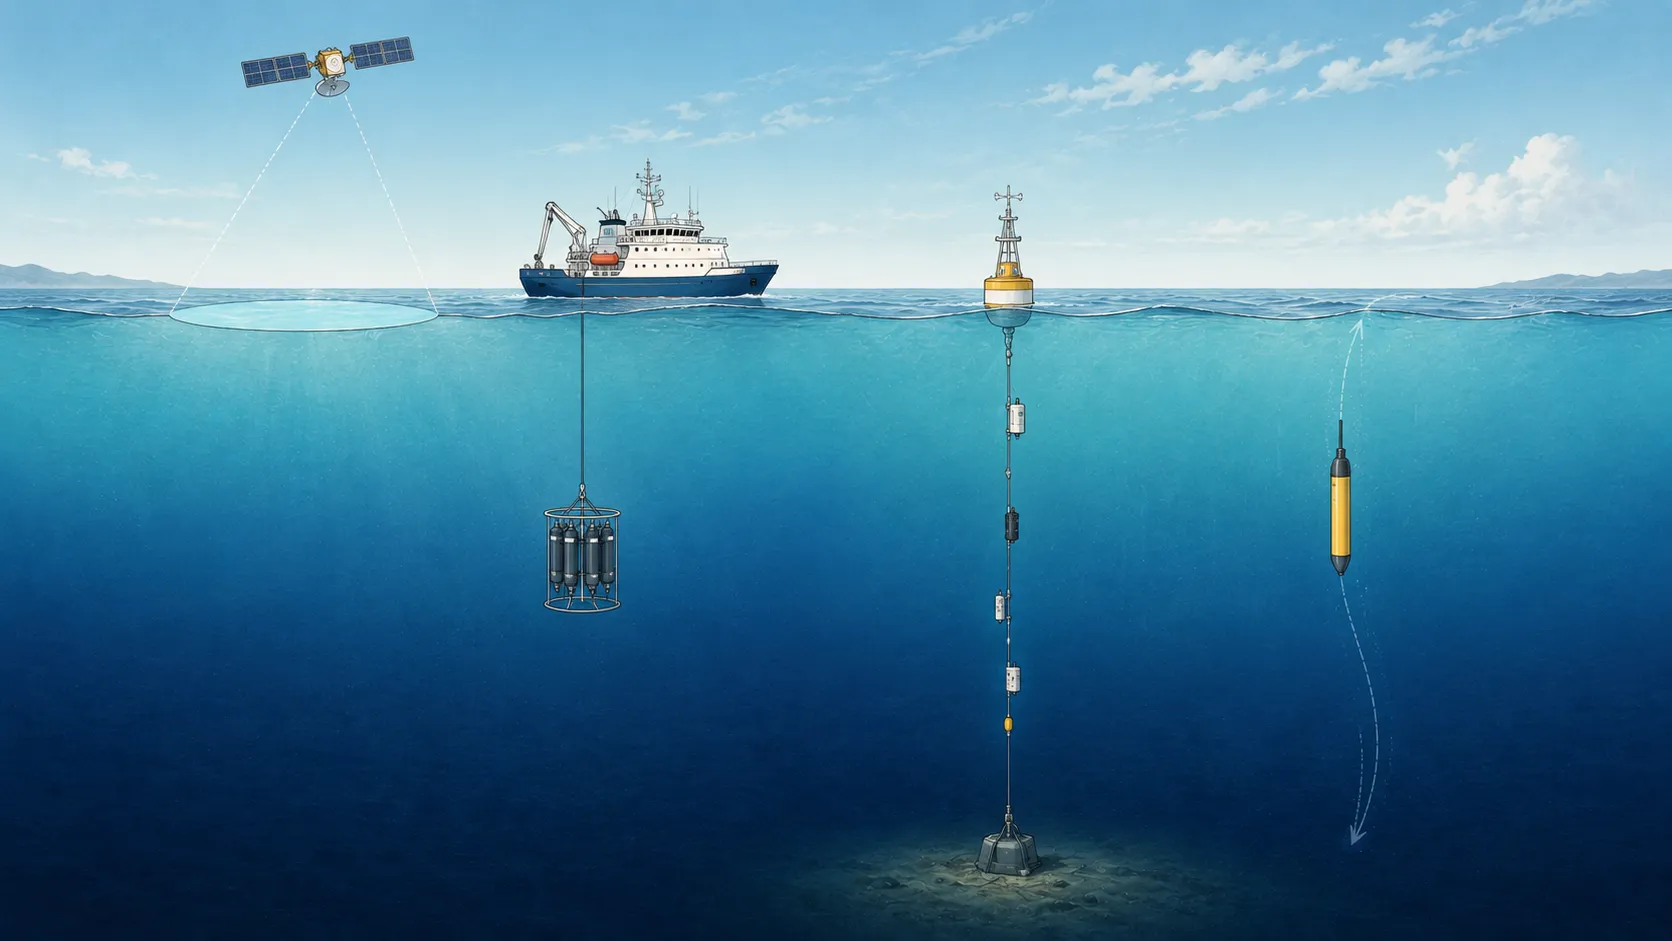
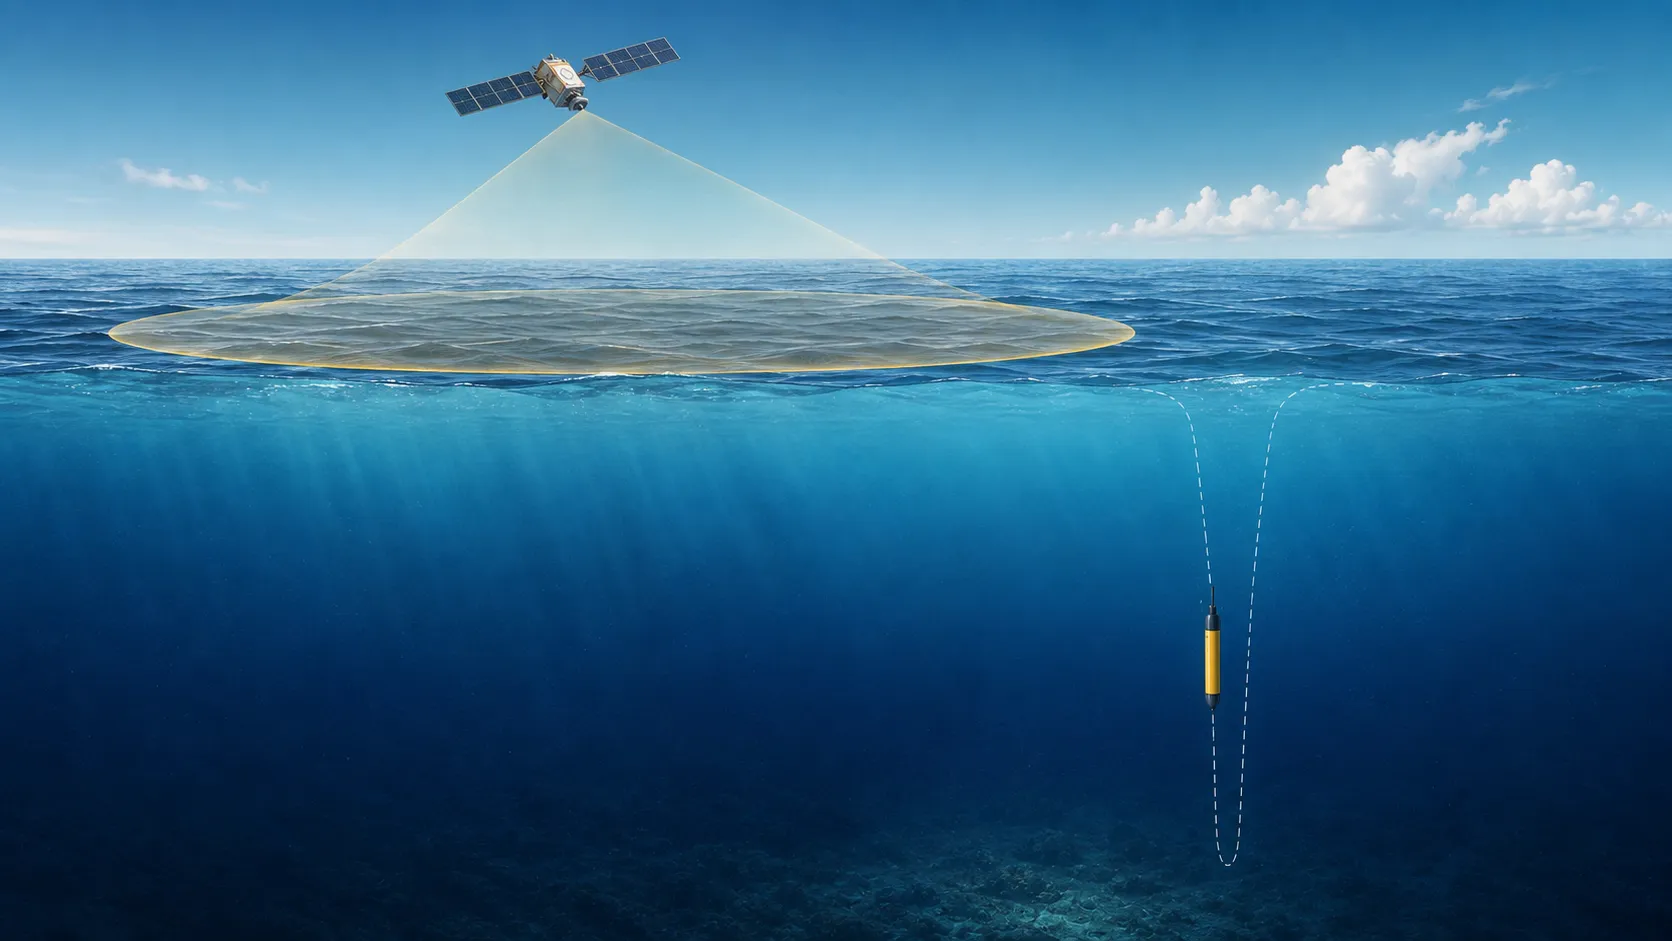
On this page
We cannot observe every part of the ocean continuously. The ocean is three-dimensional, constantly changing, and difficult to access below the surface. Every observing system samples only certain places, depths, times, and variables.
A gap on a map or chart is therefore not an unusual exception. It is part of the structure of ocean data. The important skill is learning what was measured directly, what was removed by quality control, what was interpolated, and what remains unknown.
Ocean Observation Is Sampling, Not a Complete Copy
An ideal observing system would measure the full ocean depth, at every location, continuously, with every physical, chemical, and biological sensor. No existing platform can do all of that.
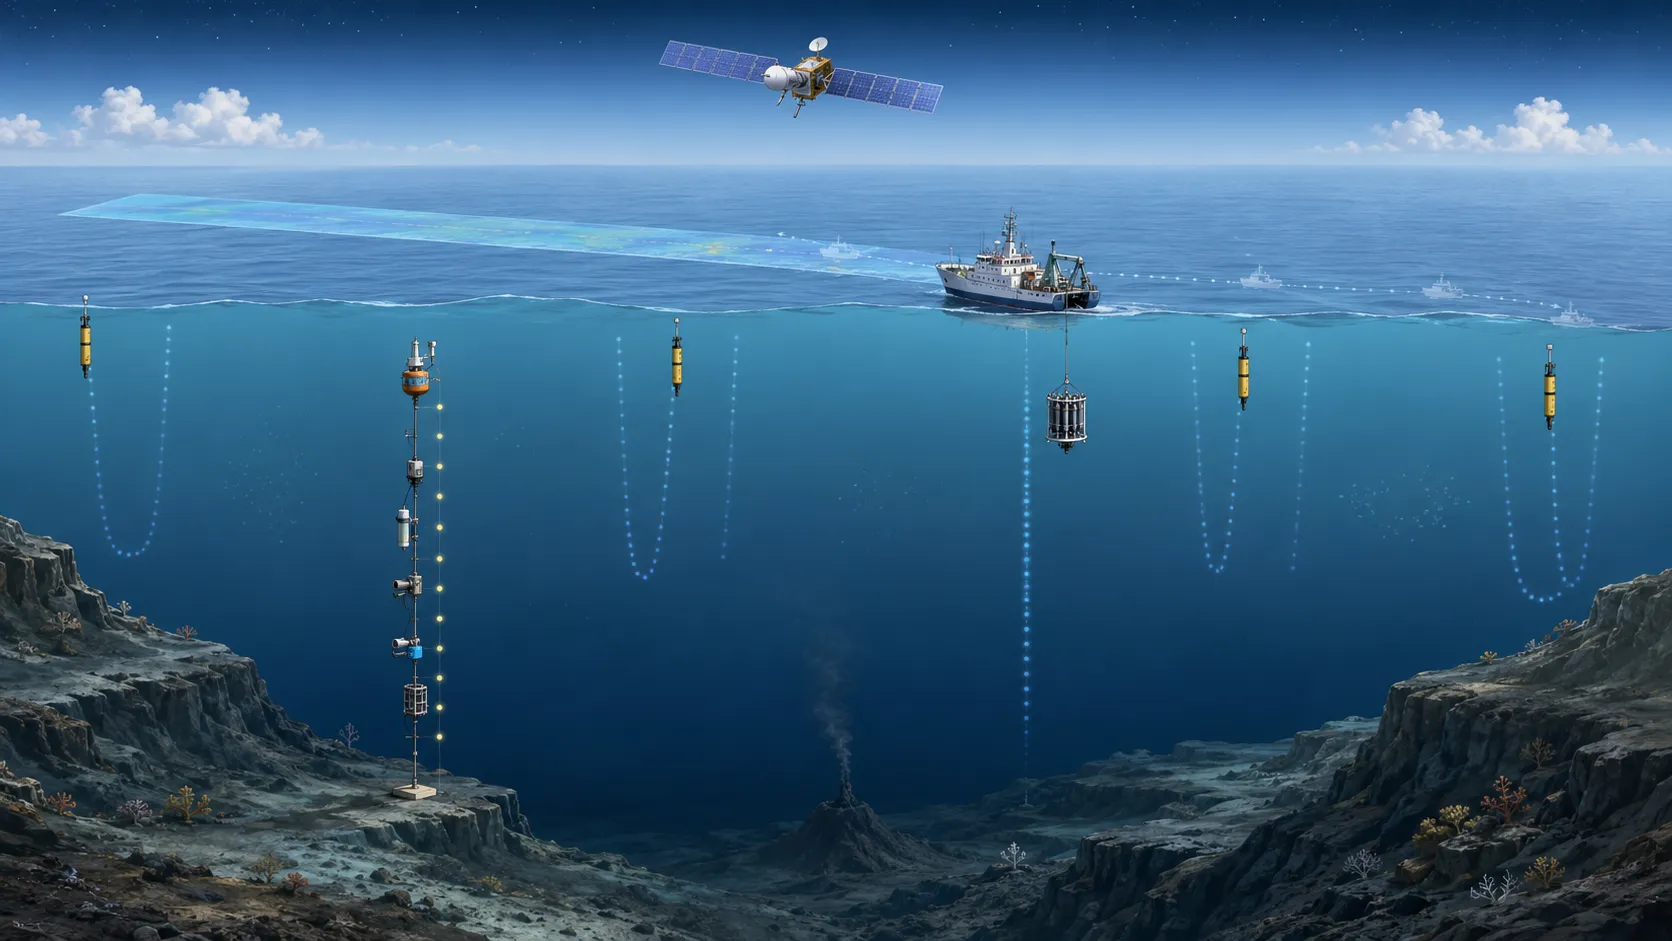
Real observing systems make different tradeoffs:
- Satellites repeat broad surface measurements but usually do not observe the full water column directly
- Research ships collect detailed measurements and water samples along limited routes and schedules
- Moorings measure one location frequently but have little horizontal coverage
- Profiling floats repeat subsurface measurements across broad regions but only at discrete positions and times
How Do Scientists Measure the Ocean? compares these systems in detail.
The schematic cutaway below makes those different sampling footprints visible.
Four Dimensions of a Data Gap
“Not enough data” can mean several different things.
A spatial gap
There may be no instrument near the place of interest. Coverage can also be uneven: some regions contain many profiles while others have few.
A temporal gap
An instrument may revisit only after the event has passed. A standard Argo mission commonly profiles about once every ten days, so it cannot resolve every storm, tide, or short-lived mixing event.
A depth gap
A surface sensor does not describe the water below. Standard Core Argo profiles usually reach about 2,000 meters, while much of the ocean is deeper. Deep Argo extends the range, but it is still expanding toward a global array.
A variable gap
Temperature and salinity are available much more widely than many chemical and biological variables. A profile can contain valid Core Argo data without dissolved oxygen, nitrate, pH, chlorophyll-related fluorescence, or other BGC measurements.
These gaps can occur together. A region may have many surface measurements but few subsurface profiles, or good temperature coverage but sparse oxygen data.
Argo Greatly Expands Coverage but Does Not Make It Uniform
Argo transformed subsurface ocean observation by distributing repeated profiles across the global ocean. Its design still represents a sampling network, not continuous coverage.
The International Argo Program’s array status notes that some ocean areas remain below their target float density. The original array also excluded many seasonal sea-ice zones and marginal seas. New technology has reduced those barriers, and the program is extending coverage into polar regions, marginal seas, the deep ocean, and biogeochemistry.
Argo’s OneArgo mission states that the Deep and BGC components are still expanding from pilot arrays toward global implementation.
Argo coverage is therefore best understood as evolving:
- Core temperature and salinity sampling is the most established
- Polar and marginal-sea coverage has improved but remains operationally challenging
- Deep Argo addresses the ocean below the standard 2,000-meter range
- BGC Argo adds important variables on a smaller subset of floats
Quality Control Can Remove Data, Not Create Missing Measurements
An instrument can return a value that is missing, physically implausible, poorly positioned, or flagged as unreliable. Quality control identifies and filters many of these problems.
That improves the data that remain, but it can also make a profile or section look sparser. If a value fails the selected quality criteria, the honest result is often a gap rather than a smooth curve.
OceanGraph does not display every profile found in Argo GDAC. Its documented processing can exclude profiles because of file type, time or position quality, missing required variables, insufficient valid levels, pressure gaps, or conversion errors. It also prefers adjusted and delayed-mode data when the required conditions are met.
The exact rules are documented in the Data Filtering Policy. For a practical introduction to the flags and adjusted variables, see Argo Data Quality Control Guide.
Measurements, Interpolation, and Models Are Different
Ocean data products often fill part of the space between direct measurements. Several terms need to remain distinct:
| Data type | Meaning |
|---|---|
| Direct measurement | A sensor sampled the variable at a stated place, time, and level |
| Interpolated value | A method estimated a value between or near available measurements |
| Analyzed field | Observations and a model or statistical method were combined on a regular grid |
| Missing value | No usable value is provided under the product’s rules |
Interpolation can make an irregular set of profiles easier to view, but it does not add a new sensor measurement. A smooth color gradient can cross an area where the original points were widely separated.
Models and data assimilation go farther by using physical equations and observations to estimate a spatially complete state. They are essential tools, but their gridded output should not be described as if every grid cell were observed directly.
No Data Does Not Mean Zero
An empty area in a chart can mean:
- No instrument sampled that location or depth
- The instrument did not carry the selected sensor
- A value failed quality control
- The data were too sparse for the display’s interpolation rules
- The requested feature could not be calculated from the profile
None of those automatically means that the physical or biogeochemical quantity was zero.
This is especially important in time-series vertical sections. OceanGraph masks areas that lack enough valid support after interpolation, leaving visible gaps instead of coloring the entire rectangle. The Limitations page explains how original sampling, quality control, and BGC sensor availability produce those gaps.
Time-Series Vertical Sections in Oceanography Explained shows how to read a missing area without treating it as an ocean feature.
What OceanGraph Shows—and What It Does Not
OceanGraph is an exploration interface for a processed subset of Argo data. It helps users inspect profiles, trajectories, θ-S structure, and selected derived views without first building a file-processing pipeline.
Its boundaries matter:
- Search markers represent profiles available under OceanGraph’s data and filtering rules
- Profile values are retained within the documented 0–2,000 dbar range
- Some BGC variables are absent from many otherwise valid profiles
- Vertical sections contain interpolation as well as masks for unsupported areas
- A float trajectory is a sequence of sampled positions, not a complete current-velocity field
- Derived metrics and detections depend on stated criteria and may be unavailable
A Checklist for Reading Sparse Ocean Data
Before drawing a conclusion from a map, profile, or section, check:
- Which platform and sensor produced the data?
- What place, time, and depth range were sampled?
- Is the displayed value measured, converted, interpolated, or derived?
- Were profiles or levels removed by quality control?
- Does an empty area mean no measurement, a rejected value, or an undefined calculation?
- Would another observing system be needed to answer the question?
In OceanGraph, begin by noting the search bounds, result count, profile dates and positions, and the variables actually present. The Search and Bookmark guide describes the available filters and profile details.