On this page
Ocean-observing satellite instruments can produce broad maps of sea-surface temperature, sea-surface height, ocean color, surface winds, sea ice, and related properties. Most do not, however, measure a full column of seawater from the surface to the deep ocean. For temperature and salinity, Core Argo floats add that missing vertical view by measuring through depth while they rise.
What a Satellite Actually Records
An Earth-observing satellite instrument records electromagnetic energy arriving at the spacecraft, or the return from a pulse sent toward Earth. Calibration, atmospheric corrections, and retrieval algorithms then turn that signal into a geophysical product.
Different sensors therefore produce different views:
| Signal recorded from orbit | Common ocean product | What the product describes |
|---|---|---|
| Thermal-infrared or microwave radiance | Sea-surface temperature | Infrared skin temperature or microwave subskin temperature, both within the uppermost millimeters |
| Nadir radar echo range, waveform, and return power | Along-track sea-surface height, significant wave height, surface wind-speed estimates | The position and roughness of the sea surface beneath the ground track |
| Visible-band radiance at the spacecraft | Water-leaving radiance, ocean color, chlorophyll-related estimates | A depth-weighted optical signal from the sunlit near-surface ocean after atmospheric correction |
| L-band microwave brightness temperature | Sea-surface salinity | Salinity inferred for roughly the upper centimeter |
| Scatterometer radar backscatter | Near-surface wind-speed and wind-direction estimates | Wind inferred from centimeter-scale roughness at the sea surface |
NOAA’s overview of Oceans and Coasts lists temperature, winds, sea level, and biological properties among the quantities monitored with satellites.
Sea-surface temperature is retrieved from radiance
Infrared and microwave radiometers detect radiation rather than touching the water. Algorithms use those observations to retrieve sea-surface temperature. Under the definitions used by the international Group for High Resolution Sea Surface Temperature, infrared radiometers represent the skin layer at roughly 10–20 micrometers, while microwave radiometers approximate the subskin temperature in about the upper millimeter.
Spatial and temporal resolution belong to a particular sensor and product, not to “satellite data” as a single category. NOAA CoastWatch’s current Sea Surface Temperature overview gives representative infrared resolutions of 1–4 kilometers and, for geostationary imagers, 10–15 minutes; microwave SST is typically coarser at about 20–50 kilometers. Infrared cannot see the ocean through cloud. Microwave can provide coverage through most clouds, but heavy rain, proximity to land or ice, radio-frequency interference, and its larger footprint introduce different limitations.
The result is extremely useful, but it remains a surface quantity. It cannot by itself reveal whether a warm surface lies above a shallow warm layer or warmth extending hundreds of meters downward. Why Sea Surface Temperature Is Not Enough to Measure Ocean Warming develops that specific distinction between surface temperature and heat stored through depth.
Altimetry starts with distance to the sea surface
A radar altimeter sends pulses toward the ocean and measures the return echo. Combining the corrected range with the satellite’s precisely known orbit yields sea-surface height. The waveform and return power also contain information about significant wave height and surface wind speed.
Unlike a wide-swath imager, a conventional nadir altimeter samples along a ground track. The Jason-3 mission description gives a roughly 10-day repeat, while ESA describes about 300-meter along-track resolution after SAR processing for Sentinel-6. Neither number describes a simultaneous 300-meter two-dimensional image: gridded sea-surface-height maps combine separated tracks and times, often from several missions and with analysis or interpolation. Sea-surface height patterns can be used to study circulation and can contribute to products that estimate subsurface conditions.
Ocean color is light, not a water sample
Ocean-color instruments record visible light that leaves the ocean and reaches the top of the atmosphere. After atmospheric correction, its spectrum can be used to estimate quantities such as chlorophyll-a concentration and water clarity. NOAA’s Ocean Color product description separates the measured radiances from the properties derived from them.
Those products describe optically visible material in the part of the upper ocean from which light returns to the sensor. That sampling depth is commonly described by the first optical depth rather than one fixed number of meters, because it changes with wavelength and water clarity. Spatial sampling also varies within a swath: for example, NOAA lists its VIIRS Level-2 ocean-color product at 750 meters at nadir and about 1.7 kilometers at the swath edge. A daily product label does not guarantee a cloud-free observation of every pixel that day.
Sea-surface salinity and surface winds use different microwave signals
Satellite sea-surface salinity is retrieved from the sensitivity of L-band microwave brightness temperature to seawater’s electrical properties. It represents a very thin surface layer and a comparatively broad footprint. As one mission-specific example, ESA describes SMOS salinity as representing the first centimeter, averaged over roughly 40 × 40 kilometers, with global coverage about every five days. Rain-created fresh layers can therefore make a satellite value differ physically from an Argo measurement taken deeper.
A scatterometer instead sends microwave pulses and measures backscatter from wind-roughened, centimeter-scale waves. Retrieval algorithms use that viewing geometry and backscatter to estimate near-surface wind speed and direction, as ESA explains for ASCAT.
Optical Signals From Below the Surface
Most operational satellite ocean products are dominated by the surface or a shallow upper layer.
Visible light can carry information from below the exact surface, with the effective depth depending on wavelength, water clarity, and the quantity being retrieved. Some active remote-sensing instruments can also detect shallow subsurface backscatter: an active instrument sends its own pulse rather than only receiving natural radiation. NASA reported that the lidar on the now-completed CALIPSO mission could detect signals from the upper 20 meters of the ocean under suitable conditions.
Satellite and in-situ observations differ in their variables, penetration depth, horizontal footprint, and sampling pattern. A careful statement is therefore that satellites mainly provide broad surface and upper-ocean remote sensing, while in-situ platforms remain necessary for much of the water column.
What Argo Measures Below the Surface
A Core Argo float carries sensors through the water itself. On a common mission, it drifts near 1,000 meters, descends toward about 2,000 meters, and measures pressure, temperature, and conductivity as it rises. Salinity is calculated from conductivity, temperature, and pressure, while the measurements also undergo calibration and quality control. The resulting profile therefore contains processed values rather than an untouched sensor record.
The International Argo Program’s float guide describes the standard cycle, which is commonly about ten days but varies by mission. Measurements are made successively during the ascent, and the float normally obtains its surface position afterward, so one profile represents a profiling cycle rather than an instantaneous cast at one fixed horizontal point. The resulting profile reveals features that a surface map cannot resolve directly, including the thickness of a warm layer, thermocline depth, subsurface salinity structure, and changes across repeated cycles.
The diagram contrasts horizontal coverage with vertical sampling.
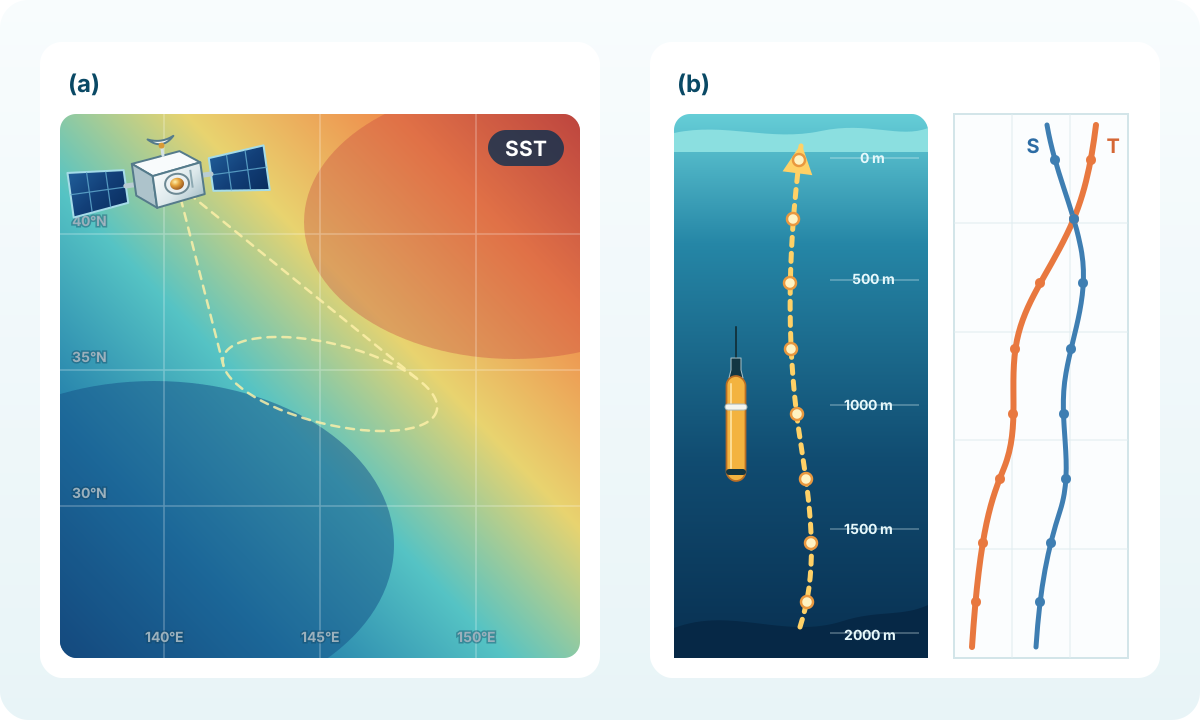
Panel (a) shows a satellite observation footprint over the broad horizontal coverage of a sea-surface-temperature field; panel (b) shows an Argo float’s upward profiling path and the temperature-salinity structure measured during ascent.
The satellite used by an Argo float has a different job
After surfacing, an Argo float uses satellites for telemetry, not for remote sensing of the water column.
The float’s sensors make and store the in-water measurements. At the surface, most floats obtain a GPS position and use the Iridium satellite network to transmit their stored data. Some floats instead use the Argos satellite system for both positioning and data transmission.
Why the Combined View Is Stronger
Suppose a satellite image shows a front, eddy, or unusually warm patch. The image can help establish the feature’s surface extent, while a sequence of suitably timed observations can show how it changes. A nearby Argo profile can then address a different set of questions:
- Does the temperature contrast continue below the mixed layer?
- Is the thermocline displaced upward or downward?
- Does salinity reinforce or oppose the temperature-related density contrast?
- Do later profiles show a similar vertical structure?
A satellite pattern can guide where to inspect profiles, while in-situ observations help interpret what a remotely sensed signal represents.
Matching the observations also requires care. A float moves between profiles and can also drift during one ascent, a satellite pass may occur hours or days away from the profile time, and the satellite footprint may represent a much larger area than the water sampled by the float. “Nearby” on a map is not automatically collocated in space and time.
Neither System Provides Complete Coverage
Satellites cover wide areas, but cloud blocks many infrared and visible-light observations, coastlines and sea ice can complicate retrievals, and every sensor has a footprint and revisit pattern. For sea-surface temperature, Level-4 (L4) products are analyzed, gridded, gap-free fields created from data collected by multiple sensors or platforms. A filled pixel therefore does not necessarily represent a cloud-free measurement made at that exact time.
Argo samples below the surface, but profiles remain separated in space and time. Floats do not all follow identical missions or reach the seafloor, and only BGC-equipped floats measure selected biogeochemical variables.
Why Can’t We Observe the Whole Ocean? explains these spatial, temporal, depth, and variable gaps, as well as the difference between direct measurements, interpolation, and analyzed fields.
Use OceanGraph for the Argo Side of the Comparison
To compare sea-surface temperature, ocean color, or altimetry with Argo profiles, open an authoritative satellite product alongside the processed profiles in OceanGraph.
A focused comparison can proceed as follows:
- In the satellite product, note the variable, acquisition time, spatial resolution, and whether the view is an observation or a gap-filled analysis.
- Search a limited area and date range in OceanGraph, then check the position and time of each candidate profile rather than choosing only by visual proximity.
- Inspect temperature and salinity through depth, including the shallowest valid measurement and the depth reached by the profile.
- Follow one float’s repeated profiles when the question concerns change over time, while remembering that the float also changes position.
The App Guide’s Data Source page defines the Argo-only source used by OceanGraph. Search and Bookmark explains how to find profiles, and Trajectory and Time-Series Vertical Section explains how to inspect repeated cycles.
For the broader context of ships, moorings, floats, and remote sensing, return to How Do Scientists Measure the Ocean?.