On this page
Sunlight fades gradually in the ocean, so the answer to “how deep?” depends on what you mean by light reaching a depth. Detectable sunlight can extend much deeper than the well-lit water that supports most photosynthesis. To compare light available to phytoplankton, oceanographers use photosynthetically active radiation (PAR) and often describe the depth where it falls to 1% of its near-surface value.
The familiar 200-meter sunlight-zone boundary is a broad description, not a measured limit that applies everywhere. NOAA’s light-depth explanation distinguishes the upper, well-lit ocean from much weaker light that can be detected as deep as about 1,000 meters under favorable conditions. Reading an individual profile requires a more specific definition.
PAR Measures a Band of Light
PAR covers wavelengths from 400 to 700 nanometers (nm). A BGC Argo radiometer can measure downward light across this band; its DOWNWELLING_PAR values describe photon flux through a horizontal area, commonly in µmol photons m⁻² s⁻¹. This counts photons arriving per unit area per second, rather than measuring photosynthetic production. The BGC Argo guide’s radiometry section explains the sensor arrangement and wavelength range.
Downwelling irradiance at 490 nm is a different measurement: a narrow spectral band, commonly expressed in W m⁻² nm⁻¹. It is not interchangeable with PAR, which spans a broad band and uses photon units here. The BGC Argo irradiance overview describes these complementary light measurements; What Does BGC Argo Measure? places them alongside oxygen, nutrients, pigments, and particles.
The 1% Depth Is a Useful Convention
Water and its dissolved and suspended material absorb light, while scattering changes its direction. The resulting decrease in downwelling PAR depends on the water’s optical properties as well as the incoming light field. Clearer water can retain a given fraction of near-surface light to greater depth than water that attenuates light strongly. Morel and colleagues’ study of ocean optical properties relates this attenuation to the illuminated layer.
An often-used definition of euphotic depth is the depth where downwelling PAR is 1% of its value just below the sea surface. This article uses that optical convention. In symbols, the condition is PAR(z) / PAR(0−) = 0.01, where 0− means immediately below the surface. Lee and colleagues (2007) explain the use of relative light depths to describe water clarity.
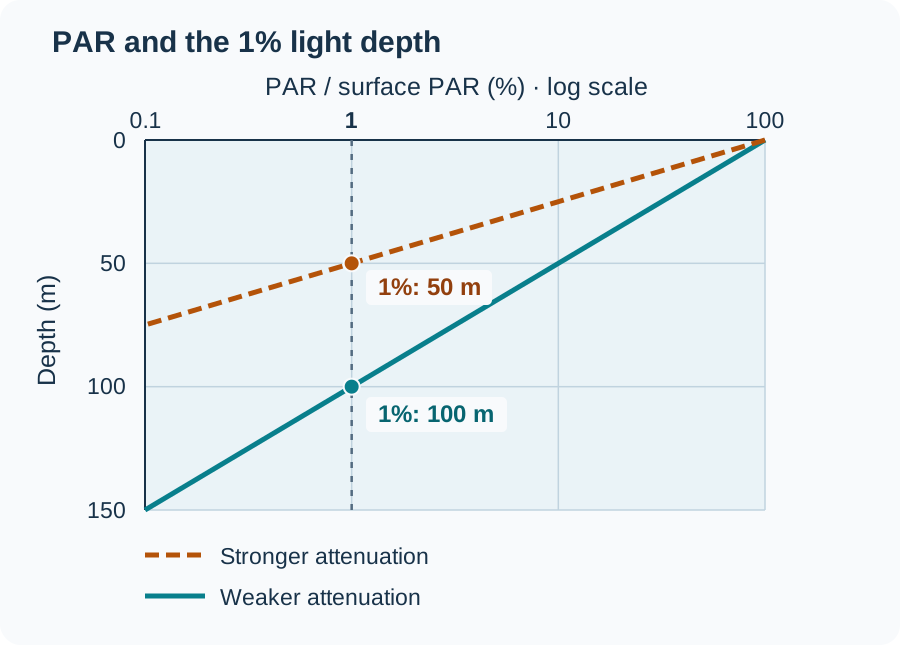
The figure compares stronger and weaker attenuation, with the attenuation rate held constant with depth in each case. Each equal step along the horizontal axis represents a tenfold change in PAR. A straight line on these axes corresponds to exponential attenuation with depth.
The compensation depth answers a different question: where gross photosynthesis balances the relevant respiration. It depends on absolute light exposure and biological conditions, including the organisms and their acclimation. The 1% horizon can approximate that boundary in some settings, but it neither marks complete darkness nor proves that photosynthesis stops there. Marra and colleagues (2023) compare optical and biological definitions of the productive layer.
The Same Percentage Can Mean Different Amounts of Light
Consider a deliberately simplified daytime example. Assume the incoming light remains steady throughout each profile, and that only its intensity changes between two profiles; the water and the angular and spectral light distributions stay the same.
| Quantity | Brighter conditions | Dimmer conditions |
|---|---|---|
| PAR just below the surface | 1,000 | 200 |
| PAR at the 1% depth | 10 | 2 |
All four PAR values are illustrative, in µmol photons m⁻² s⁻¹. The 1% depth is the same under these assumptions, although the absolute light there differs fivefold.
A real cloudy profile is more complicated. Clouds can pass while a float ascends, and the sun’s elevation changes with latitude, season, and local time. A bend in the curve may therefore reflect changing illumination during sampling as well as a change in the water. Radiometric quality assessment must account for this sampling problem, as discussed by Organelli and colleagues (2016).
A single daytime profile does not measure the day’s accumulated photon exposure. A nighttime profile also cannot establish the daytime euphotic depth by dividing two readings near the sensor’s dark signal, the output it gives even without incoming light.
Read a PAR Profile Before Estimating a Depth
Start with the WMO ID, cycle, position, date, and UTC time. Use the position and time to establish whether the profile was sampled in daylight. Then check the available pressure range and trace the finite PAR values downward.
For a 1% estimate, the reference value matters as much as the deep reading. The shallowest available sample may be several meters below the surface, so its 1% level is not automatically the conventional surface-referenced level. A quantitative estimate needs a defensible just-below-surface reference, adequate measurements around the crossing, and a stated interpolation or fitting method. If the profile never reaches the threshold within its usable coverage, the euphotic depth cannot be determined within that range. The deepest sample cannot be treated as the boundary.
Argo uses pressure as its vertical coordinate. In the upper ocean, 1 dbar is approximately 1 meter, but converting pressure to geometric depth depends on latitude and seawater properties.
A blank area is not a dark layer
Missing PAR can result from sensor coverage, sampling choices, or quality filtering. OceanGraph’s limitations guide notes that PAR coverage is commonly concentrated around 0–200 dbar. Blank deeper sections therefore cannot locate the limit of sunlight. A section may also be unavailable when individual profiles have values but adjacent cycles do not provide enough support to draw it.
Near-zero readings require care too. Radiometers have dark signals, temperature sensitivity, and possible drift; Jutard and colleagues (2021) describe corrections for these effects. Sensor orientation and shading can further affect a reading. OceanGraph also rounds published PAR to 0.1 µmol m⁻² s⁻¹, so a displayed zero does not necessarily mean complete darkness.
Before quantitative work, inspect the source Argo data, parameter-specific data mode, adjusted values where available, and quality flags. The official radiometry QC manual and OceanGraph’s Data Filtering Policy cover different parts of that review.
Compare Light With Chlorophyll and Nutrients
Find where PAR becomes weak relative to the near-surface reading, then compare that pressure range with chlorophyll and nitrate if they are available. A chlorophyll maximum near dimmer, nutrient-richer water can help frame a biological interpretation, but a pigment peak is not a direct measurement of biomass or growth. Reading deep chlorophyll maxima explains that distinction, while reading nitrate profiles explains the nutrient context.
Light also helps identify where photosynthetic oxygen production could occur. Gas exchange, respiration, and transport also affect oxygen structure, as described in Where Is Oxygen Found in the Ocean?.
Explore PAR in OceanGraph
- Search a region and date range, then enable Only profiles with BGC. This selects profiles containing any supported BGC variable, so confirm that PAR itself is present.
- Open the profile charts, then select PAR. Consider the time and location when checking pressure coverage, gaps in the curve, and unusual near-surface changes.
- Compare nearby cycles and the available chlorophyll, nitrate, temperature, and salinity profiles. Keep changes in illumination and the float’s movement in mind.
OceanGraph displays PAR in its charts; downwelling irradiance at 490 nm can be examined in downloaded profile data. The Search and Bookmark guide explains profile discovery and download controls. On desktop browsers, you can compare downloaded JSON profiles through the Analysis Lab Vertical Profiles guide.
References
- BGC Argo: Downwelling irradiance
- Lee et al. (2007): Euphotic zone depth, its derivation and implications
- Marra et al. (2023): Parameters for the depth of the ocean’s productive layer
- Organelli et al. (2016): Quality control for radiometric profiles measured by Bio-Argo floats
- Jutard et al. (2021): Correcting BGC Argo radiometry for temperature dependence and drift