On this page
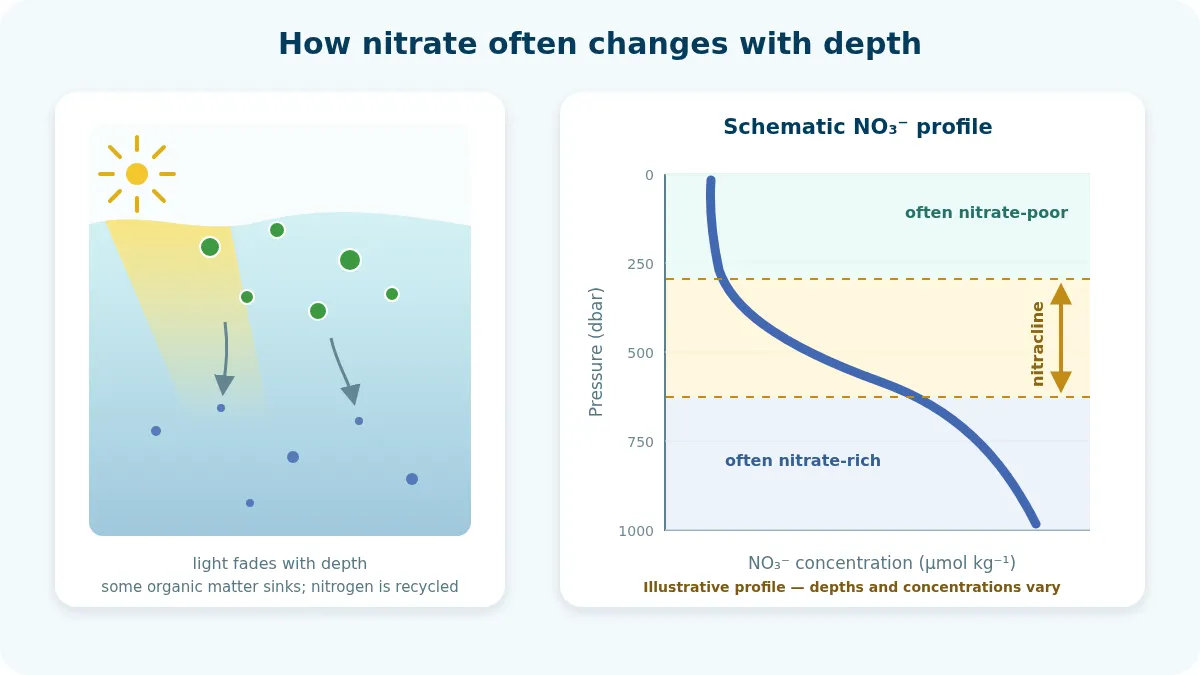
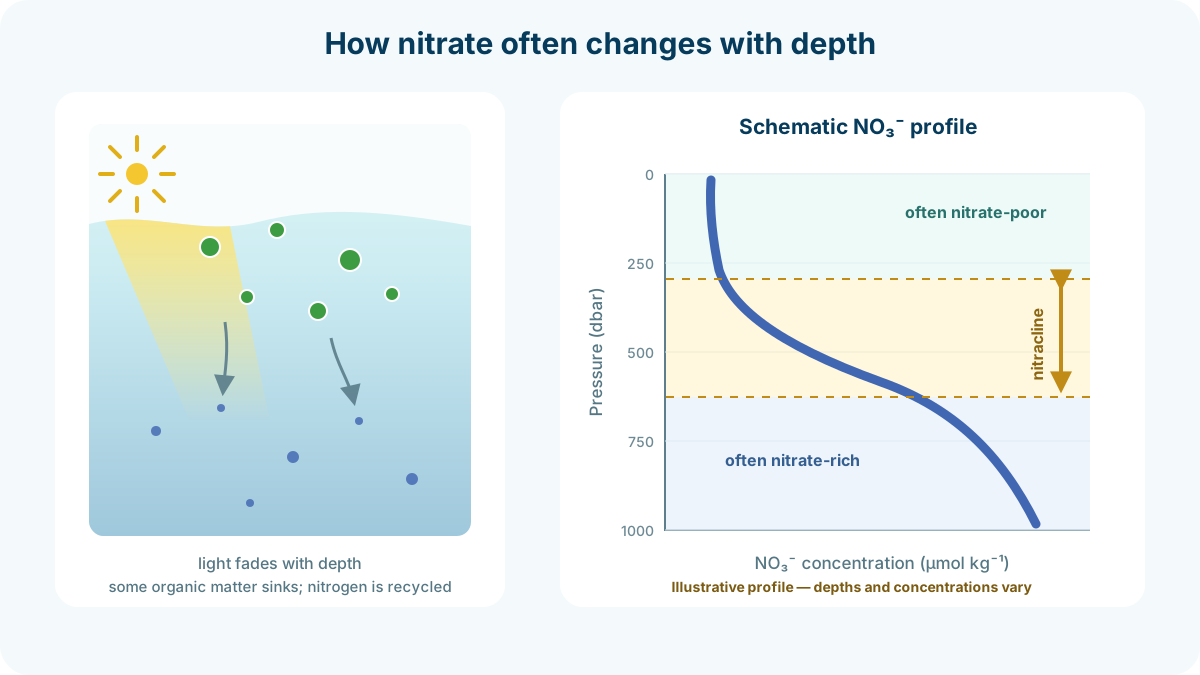
Ocean nitrate is often scarce in the sunlit surface layer and more abundant below it. The transition where nitrate rises rapidly with depth is commonly called the nitracline. Season, latitude, mixing, upwelling, circulation, and biological activity can all reshape a profile.
For an overview of the full sensor suite, begin with What Does BGC Argo Measure?.
What a BGC Argo Nitrate Profile Measures
Nitrate, NO₃⁻, is an inorganic form of nitrogen used by phytoplankton and other primary producers. It is a key nutrient in much of the ocean, although nitrate availability alone does not determine growth: light, iron, phosphate, silicate, temperature, and ecological interactions may also matter.
BGC Argo floats estimate nitrate concentration in micromoles per kilogram (µmol/kg). According to the international BGC Argo nitrate description, the sensor sends deep-ultraviolet light through seawater and measures the transmitted spectrum. Processing separates nitrate’s relatively weak characteristic absorption from the much stronger bromide absorption and calculates the concentration.
Pressure provides the vertical coordinate. In the upper ocean, a pressure difference of 1 dbar is close to 1 meter of depth, but pressure and geometric depth are not identical.
Why Nitrate Often Increases Below the Surface
In a stratified, sunlit upper ocean, phytoplankton can remove nitrate from the water as they grow. Some of the resulting organic matter sinks, and remineralization can release its nitrogen as ammonium. Where oxygen is available, nitrifying microbes can then oxidize ammonium to nitrite and nitrate. Mixing, upwelling, subduction, and horizontal circulation redistribute these forms of nitrogen. The profile at one place and time reflects the combined history of these biological and physical processes.
This often produces nitrate-poor water near the surface, a zone of rapid increase beneath it, and higher concentrations farther down.
The simple pattern has important exceptions. Winter mixing or coastal upwelling can carry nitrate into the surface layer. High-latitude waters may retain surface nitrate when light or another nutrient limits growth. In low-oxygen waters, microbial nitrogen loss can also alter the deep profile. Nitrate therefore does not have to rise smoothly or continuously all the way down.
The Nitracline Is a Transition, Not a Universal Depth
The nitracline is the part of a profile where nitrate changes rapidly with depth. It separates relatively nitrate-poor upper water from richer water below in many, but not all, settings.
There is no single threshold that works for every region and question. Published studies have used a chosen concentration, a maximum-gradient region, or upper and lower concentration bounds. Those definitions can give different depths for the same profile, especially when surface nitrate is already measurable or the increase occurs in several steps.
For exploratory reading, describe what is actually visible before assigning one number:
- the pressure range over which nitrate remains low
- where the sustained increase begins
- whether the transition is sharp, broad, or split into several gradients
- the concentration and observed pressure coverage below the transition
If the analysis requires a nitracline depth, define the calculation rule and test whether it behaves sensibly across every profile being compared. A visually chosen depth should not be presented as an objective derived measurement.
How to Read a Nitrate Profile
1. Confirm the profile context
Check the WMO ID, cycle, date, location, pressure range, and whether nitrate is actually present. In OceanGraph’s search panel, the Only profiles with BGC filter identifies profiles containing at least one supported BGC variable; it does not guarantee that nitrate is among them.
2. Trace the shape before explaining it
Start at the shallowest finite measurement and follow the line downward. Examine near-surface values, sustained gradients, local maxima or minima, abrupt steps, and gaps. Avoid calling the first small increase a nitracline if the profile immediately returns to its previous level.
3. Compare nitrate with light and chlorophyll
PAR estimates the light available for photosynthesis, whereas spectral downwelling irradiance tracks how light in a particular wavelength band attenuates with depth. Chlorophyll fluorescence is an imperfect optical proxy for chlorophyll-a concentration because fluorescence yield also varies with physiology and community composition. A fluorescence-derived chlorophyll maximum near a nitrate gradient can be informative, but it does not prove that the nitrate gradient caused the maximum or that growth is fastest there.
OceanGraph currently charts PAR; downwelling irradiance at 490 nm is available in profile downloads.
How Does Chlorophyll Change With Depth? explains why a chlorophyll peak may reflect extra pigment per cell, more biomass, or both. That distinction is essential before treating chlorophyll as evidence of nitrate consumption.
4. Read temperature and salinity as physical context
A nitrate step aligned with a temperature or salinity change may mark a mixed-layer boundary, stratification, a front, or water from a different source.
5. Use oxygen as supporting evidence, not a mirror image
Remineralization can release nutrients while respiration consumes oxygen, so increasing nitrate and decreasing oxygen may occur together. Circulation, ventilation, and nitrogen-loss processes can break that relationship. Where Is Oxygen Found in the Ocean? provides the broader oxygen-depth context and explains why oxygen also needs a multi-process interpretation.
6. Compare neighboring cycles
One profile is a vertical snapshot. Repeated cycles can show whether a gradient shoals, deepens, weakens, or disappears. Read them alongside the trajectory because the changes also include differences encountered as the float moves.
Three Common Profile Patterns
A deep transition under a nitrate-poor surface
This is common in strongly stratified, nutrient-poor regions. It is consistent with biological removal in the illuminated layer and limited resupply from below. It does not, by itself, prove present-day nitrogen limitation or quantify production.
Nitrate extending into the surface layer
Mixing, upwelling, recent nutrient supply, or regional water-mass properties may explain the profile. High surface nitrate does not necessarily mean high current productivity: phytoplankton may be light-limited, limited by another nutrient, recently supplied, or responding on a different timescale.
Steps, inversions, or more than one gradient
Several water masses, vertical displacement of density surfaces, fronts, eddies, or measurement problems can all produce complex shapes. Compare temperature, salinity, adjacent profiles, and quality information before smoothing the feature away or assigning a biological cause.
Quality, Adjusted Values, and Missing Data
Optical nitrate measurements can contain offsets and other sensor or processing uncertainties. The BGC Argo nitrate quality-control manual documents the tests and adjustments used by the program; quantitative analysis should consult the current manual and the original Argo variables, data modes, and quality flags.
OceanGraph prefers an adjusted nitrate field when a finite adjusted series and its quality information are available; otherwise it uses the raw field. It masks selected-source QC flags 4 and 9, but the remaining flags do not all mean the same thing. The OceanGraph data-filtering policy describes this publishing subset.
Near zero, sensor uncertainty or an adjustment can yield a small negative number. Negative nitrate is not a physical concentration; treat such a value as an uncertainty and QC question rather than as nutrient below zero. Likewise, null is missing data, not measured zero.
Time-series sections introduce another distinction. OceanGraph interpolates vertically only between finite measurements within a profile and does not interpolate across missing cycles. Blank areas may mean missing or masked measurements, or too little adjacent-cycle support to draw a section. The App Guide’s limitations page explains these cases.
Explore Nitrate Structure in OceanGraph
Use a consistent sequence so that an attractive color field does not replace profile-level checks:
- Search a focused region and date range, then use Only profiles with BGC to reduce the result set.
- Open a profile and confirm that nitrate has finite values, along with the WMO ID, cycle, date, location, and pressure coverage.
- Read nitrate beside temperature, salinity, chlorophyll, and PAR when those variables are available.
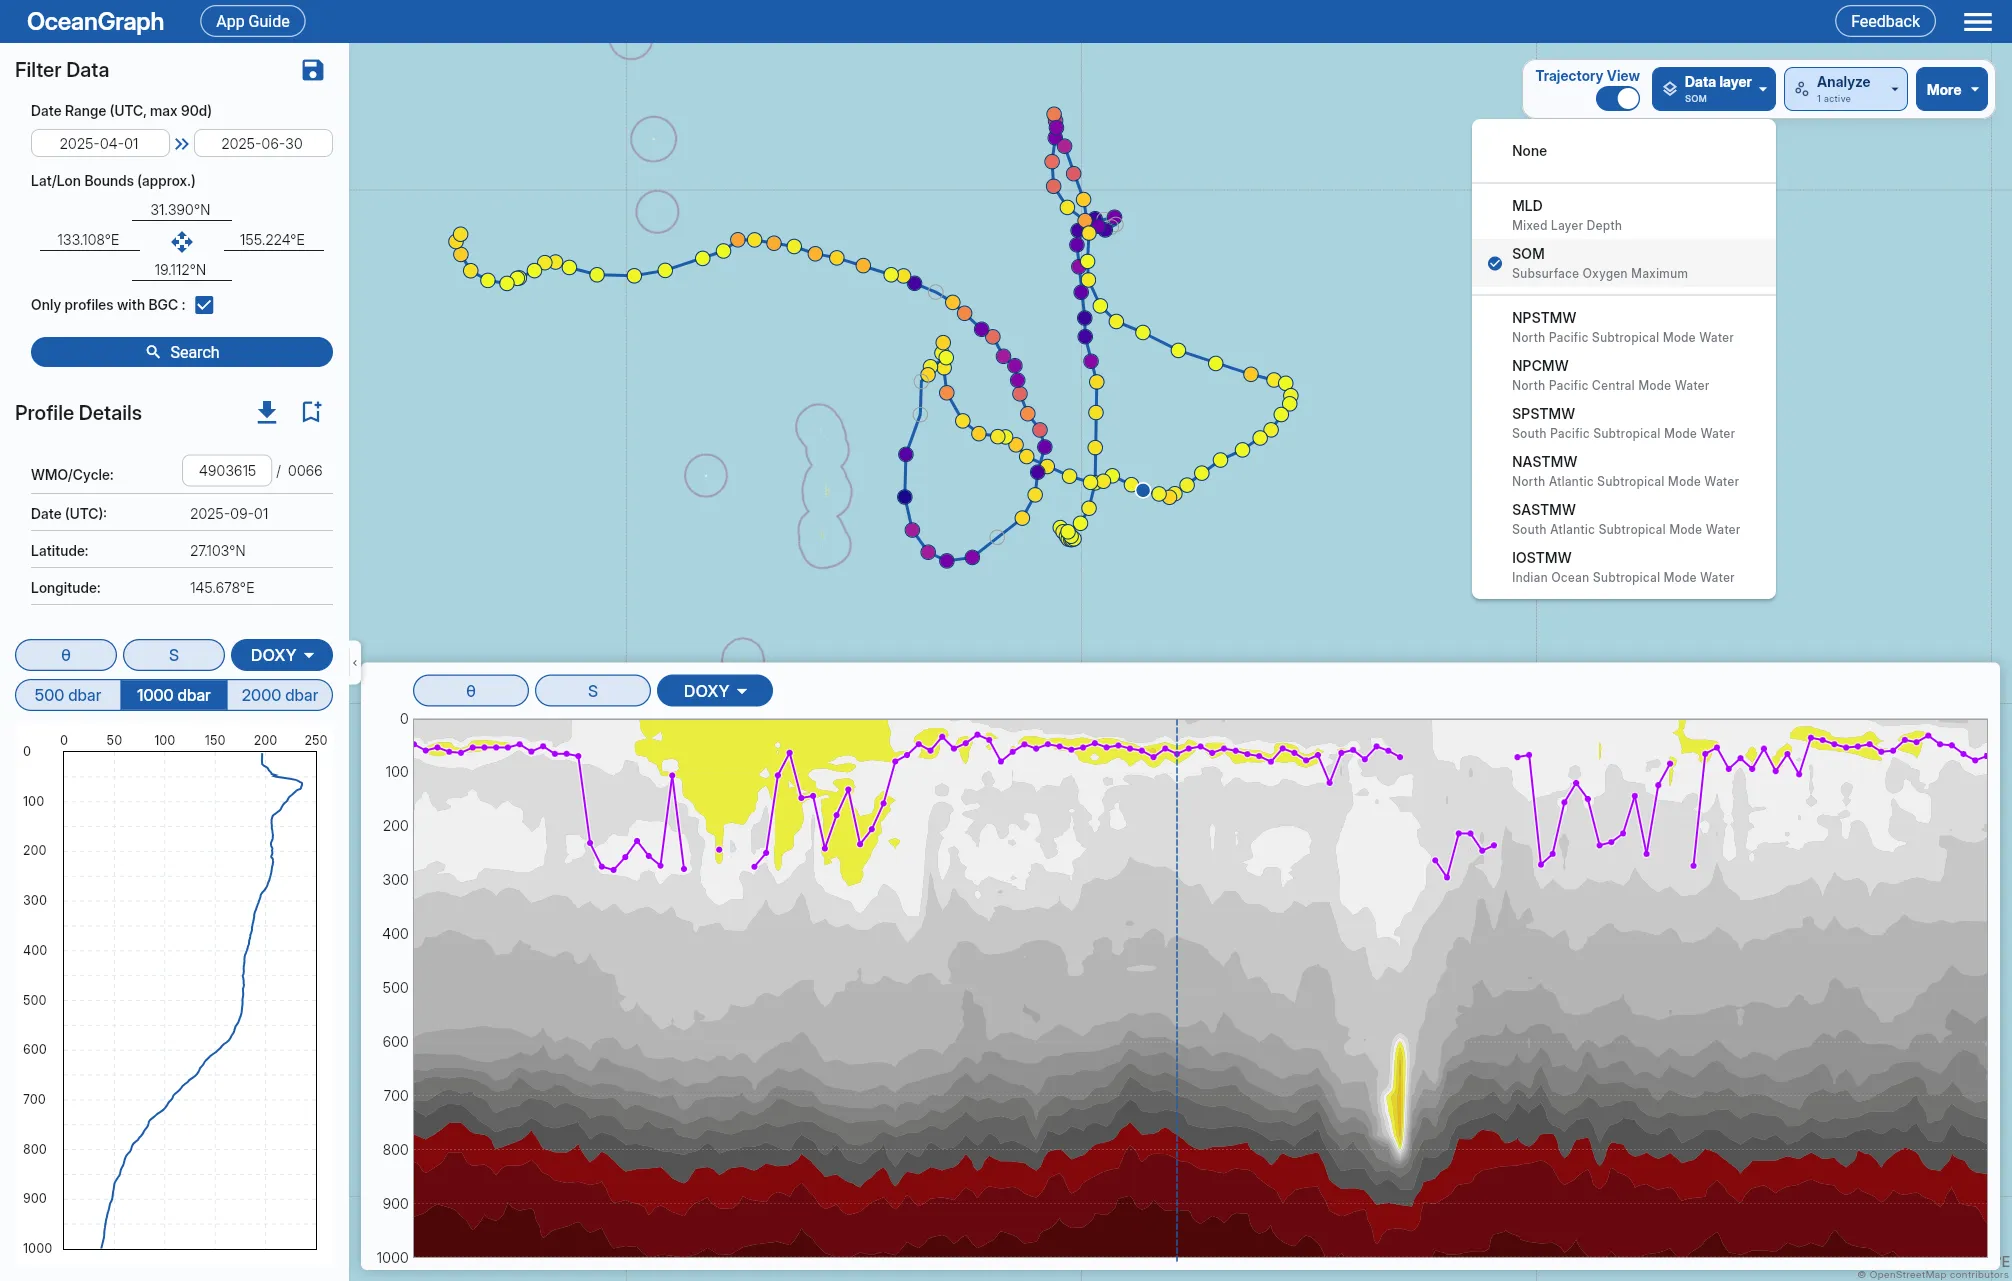
- Turn on Trajectory, open Analyze, and select View section to see how nitrate structure changes across the float’s published cycles.
- If the section shows a sharp boundary, isolated feature, or gap, check the corresponding individual profiles as well.
The Search and Bookmark guide documents the BGC filter and profile controls. The Trajectory and Time-Series Vertical Section guide explains the section workflow and its interpolation limits.