On this page
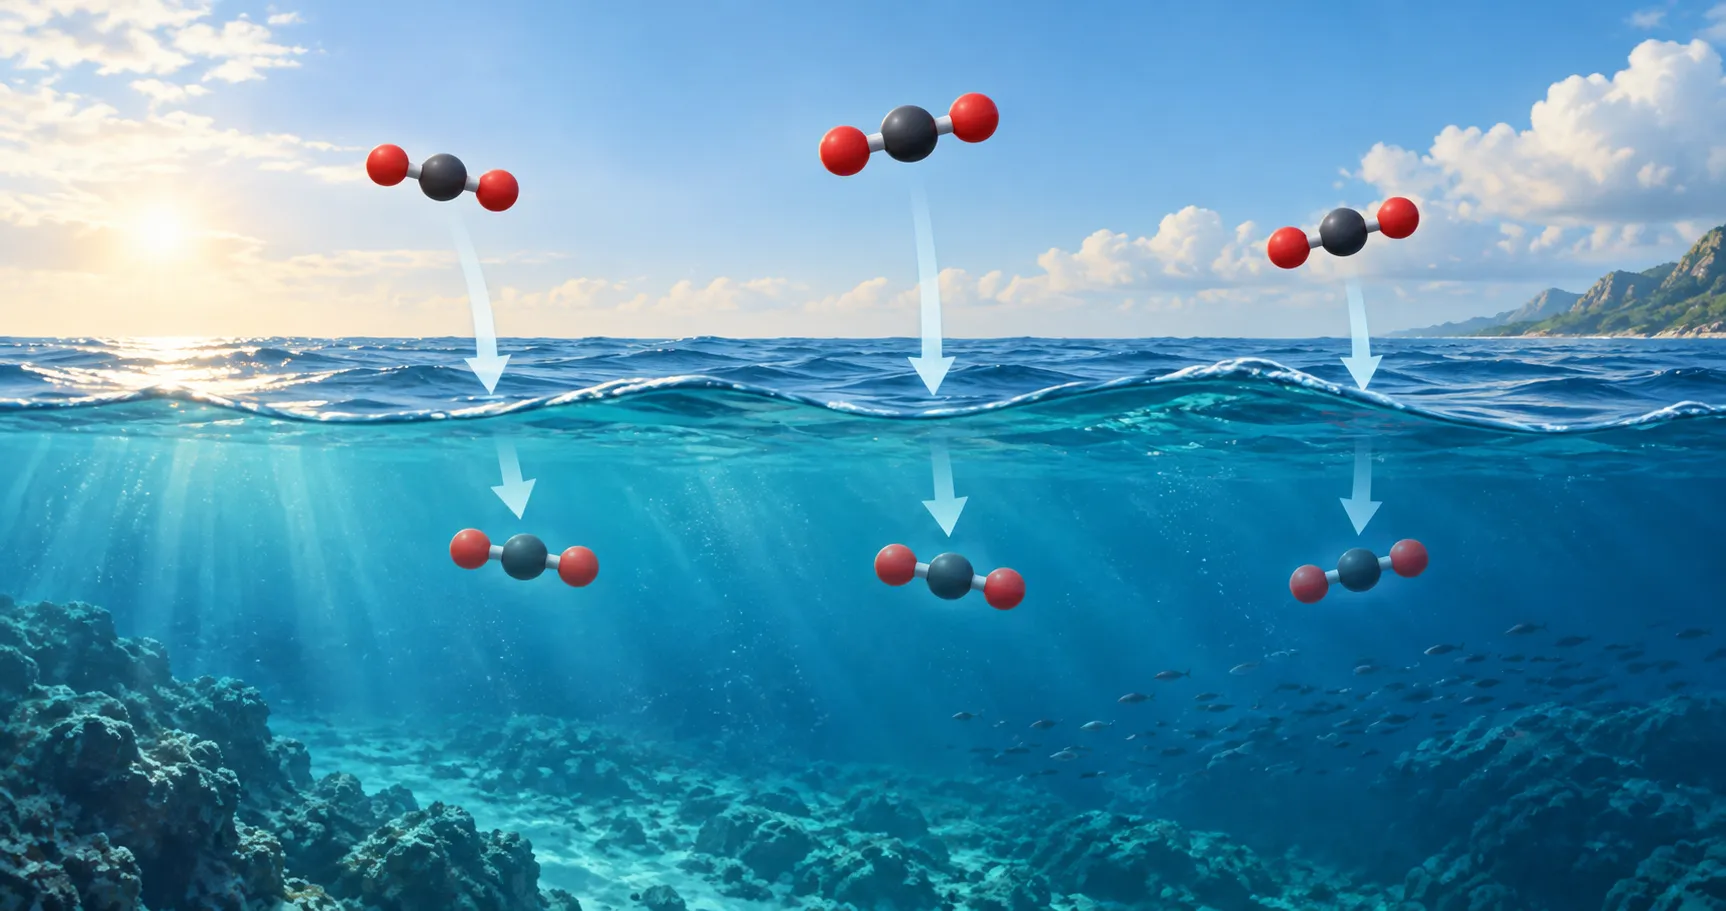
Ocean acidification is a long-term decrease in seawater pH, driven primarily by the ocean taking up carbon dioxide released by human activities. BGC Argo floats reveal vertical pH profiles and changes between cycles. NOAA’s ocean acidification overview explains the global process.
Why Adding Carbon Dioxide Lowers pH
When carbon dioxide dissolves in seawater, it participates in reactions involving carbonic acid, bicarbonate, carbonate, and hydrogen ions. Adding CO₂ shifts this chemical balance toward more hydrogen ions and lower pH. Some hydrogen ions react with carbonate ions to form bicarbonate, reducing the carbonate available for calcium carbonate shells and skeletons. These linked reactions are described in NOAA’s seawater chemistry explanation.
The word acidification describes the direction of change. It does not require the ocean to cross pH 7. Nor is pH 7 a universal biological damage threshold: changes in carbonate chemistry can affect organisms while the surrounding seawater remains alkaline.
pH is logarithmic. On the same pH scale and under comparable conditions, a decrease of one pH unit corresponds to a tenfold increase in the hydrogen-ion quantity represented by that scale. A hypothetical fall from 8.1 to 8.0 gives a factor of 10^0.1, about 1.26: roughly a 26% increase. NOAA AOML explains why small pH differences matter.
A Low-pH Layer Has Several Possible Causes
Below the sunlit layer, organisms break down sinking organic matter. Aerobic respiration consumes oxygen and returns dissolved inorganic carbon to the water, which can lower pH. In the illuminated upper ocean, photosynthetic carbon uptake can instead raise pH. Mixing, currents, and upwelling redistribute water with different chemical histories, while temperature and pressure also affect the pH value.
This helps explain why pH often decreases below the surface, but it does not prescribe one profile shape for every ocean basin. The Japan Meteorological Agency’s account of ocean acidification includes an observed mean vertical distribution in the northwestern subtropical Pacific. The BGC Argo pH overview describes the biological and physical processes behind shorter-term variability.
If low pH accompanies low oxygen, respiration and the water’s ventilation history are plausible contributors. That coincidence does not tell you how much of the carbon came from human emissions. Read Where Is Oxygen Found in the Ocean? for the physical and biological context of oxygen with depth.
Depth Differences, Short-Term Changes, and Long-Term Trends
These are three different comparisons. Start by checking which coordinate changes between the values you are reading.
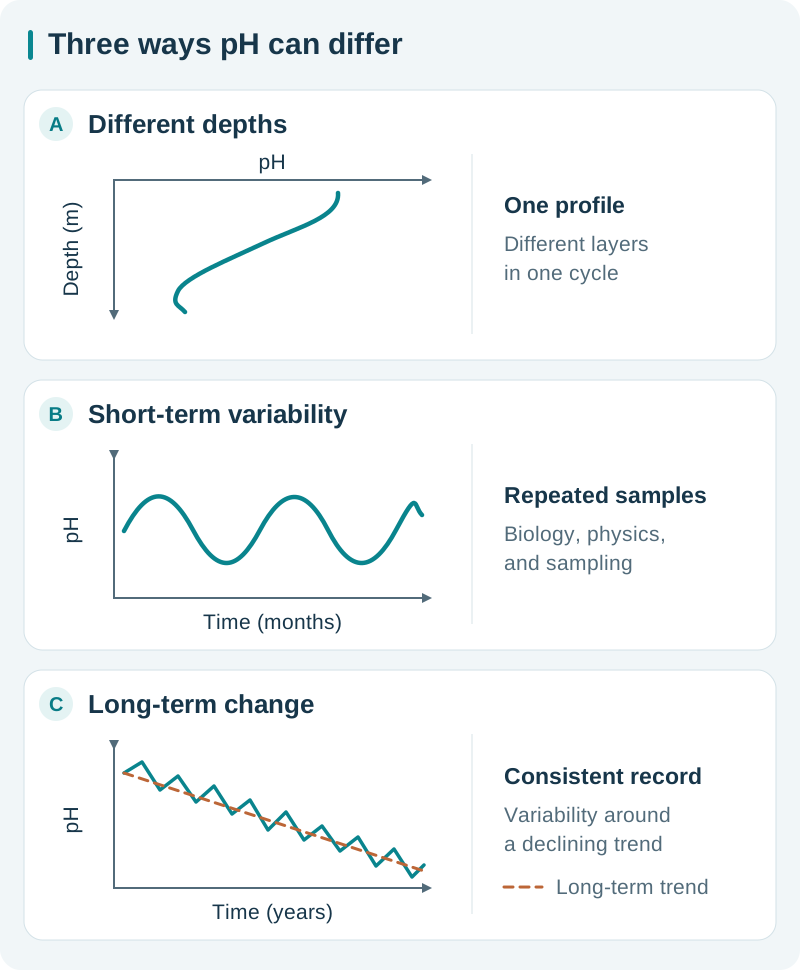
From top to bottom: pH differences with depth, short-term variability, and long-term change. The dashed line shows the long-term trend.
Several float cycles also change location
A drifting float can encounter a front or another water mass between cycles. A downward shift in its pH curve could therefore reflect movement, seasonal change, or a change in measurement quality. Check the trajectory and physical profiles before calling the difference a local time trend.
A long record requires a consistent comparison
An acidification rate needs a sufficiently long, quality-assessed record with comparable sampling. Seasonal coverage, gaps, changes in instruments or locations, and uncertainty in the fitted trend all matter. There is no universal number of years that makes any record adequate. Sutton and colleagues’ trend-analysis study explains how variability and sampling affect the ability to detect change.
For a measured example, the Japan Meteorological Agency summarizes ship observations along 137°E during 1983–2007: mean surface pH trends of −0.018 ± 0.002 per decade in winter and −0.013 ± 0.005 in summer. The JMA explanation and its cited study give the geographical and observational context.
Check the pH Scale and Measurement Conditions
BGC Argo reports PH_IN_SITU_TOTAL: pH on the total scale at in-situ temperature and pressure. Its pH sensors use an ion-sensitive solid-state sensing principle, and their measurements are processed with the accompanying physical data. See the BGC Argo pH measurement description.
The total scale is a seawater-specific convention that accounts for hydrogen bound as bisulfate as well as free hydrogen ions. It differs from other pH scales; values should not be combined solely because both columns are labeled “pH.”
In-situ pH describes the conditions where the water was sampled. A laboratory value reported at a fixed temperature, or a value recalculated at a reference pressure, answers a different comparison. Temperature and pressure affect pH even when total dissolved inorganic carbon and total alkalinity are unchanged. A conversion requires carbonate-system information and appropriate equilibrium constants, not a universal offset. The NOAA-hosted CO₂-system methods report explains these dependencies and scale conventions.
Calculating quantities such as carbonate-ion concentration or the saturation state of aragonite, a calcium carbonate mineral, generally requires another independent carbon-system parameter, such as total alkalinity, together with temperature, salinity, pressure, and relevant chemical inputs. An estimated alkalinity adds assumptions and uncertainty. NOAA’s Ocean Carbon and Acidification Data System describes the calculation context.
Read Quality Information at the pH-Parameter Level
BGC processing status can differ between parameters. Oxygen may have delayed-mode review while pH in the same profile does not. Check the pH entry in PARAMETER_DATA_MODE: R for real-time, A for real-time adjusted, or D for delayed-mode data.
For A or D pH, inspect PH_IN_SITU_TOTAL_ADJUSTED with its own _ADJUSTED_QC and _ADJUSTED_ERROR fields where provided. Do not attach the raw variable’s QC flags to adjusted values, or interpret an adjusted field’s presence as proof that all depths are usable. This parameter-level workflow is documented in Bittig and colleagues’ BGC Argo guide.
Sensor offsets and drift matter when comparing small differences. Raw data should not be promoted into an acidification result simply because adjusted data are unavailable. BGC Argo’s data management guidance links the pH processing and quality-control manuals and explains why adjustments are often necessary before scientific use. The Argo data-quality article introduces the fields and OceanGraph’s selection rules.
Inspect pH Structure in OceanGraph
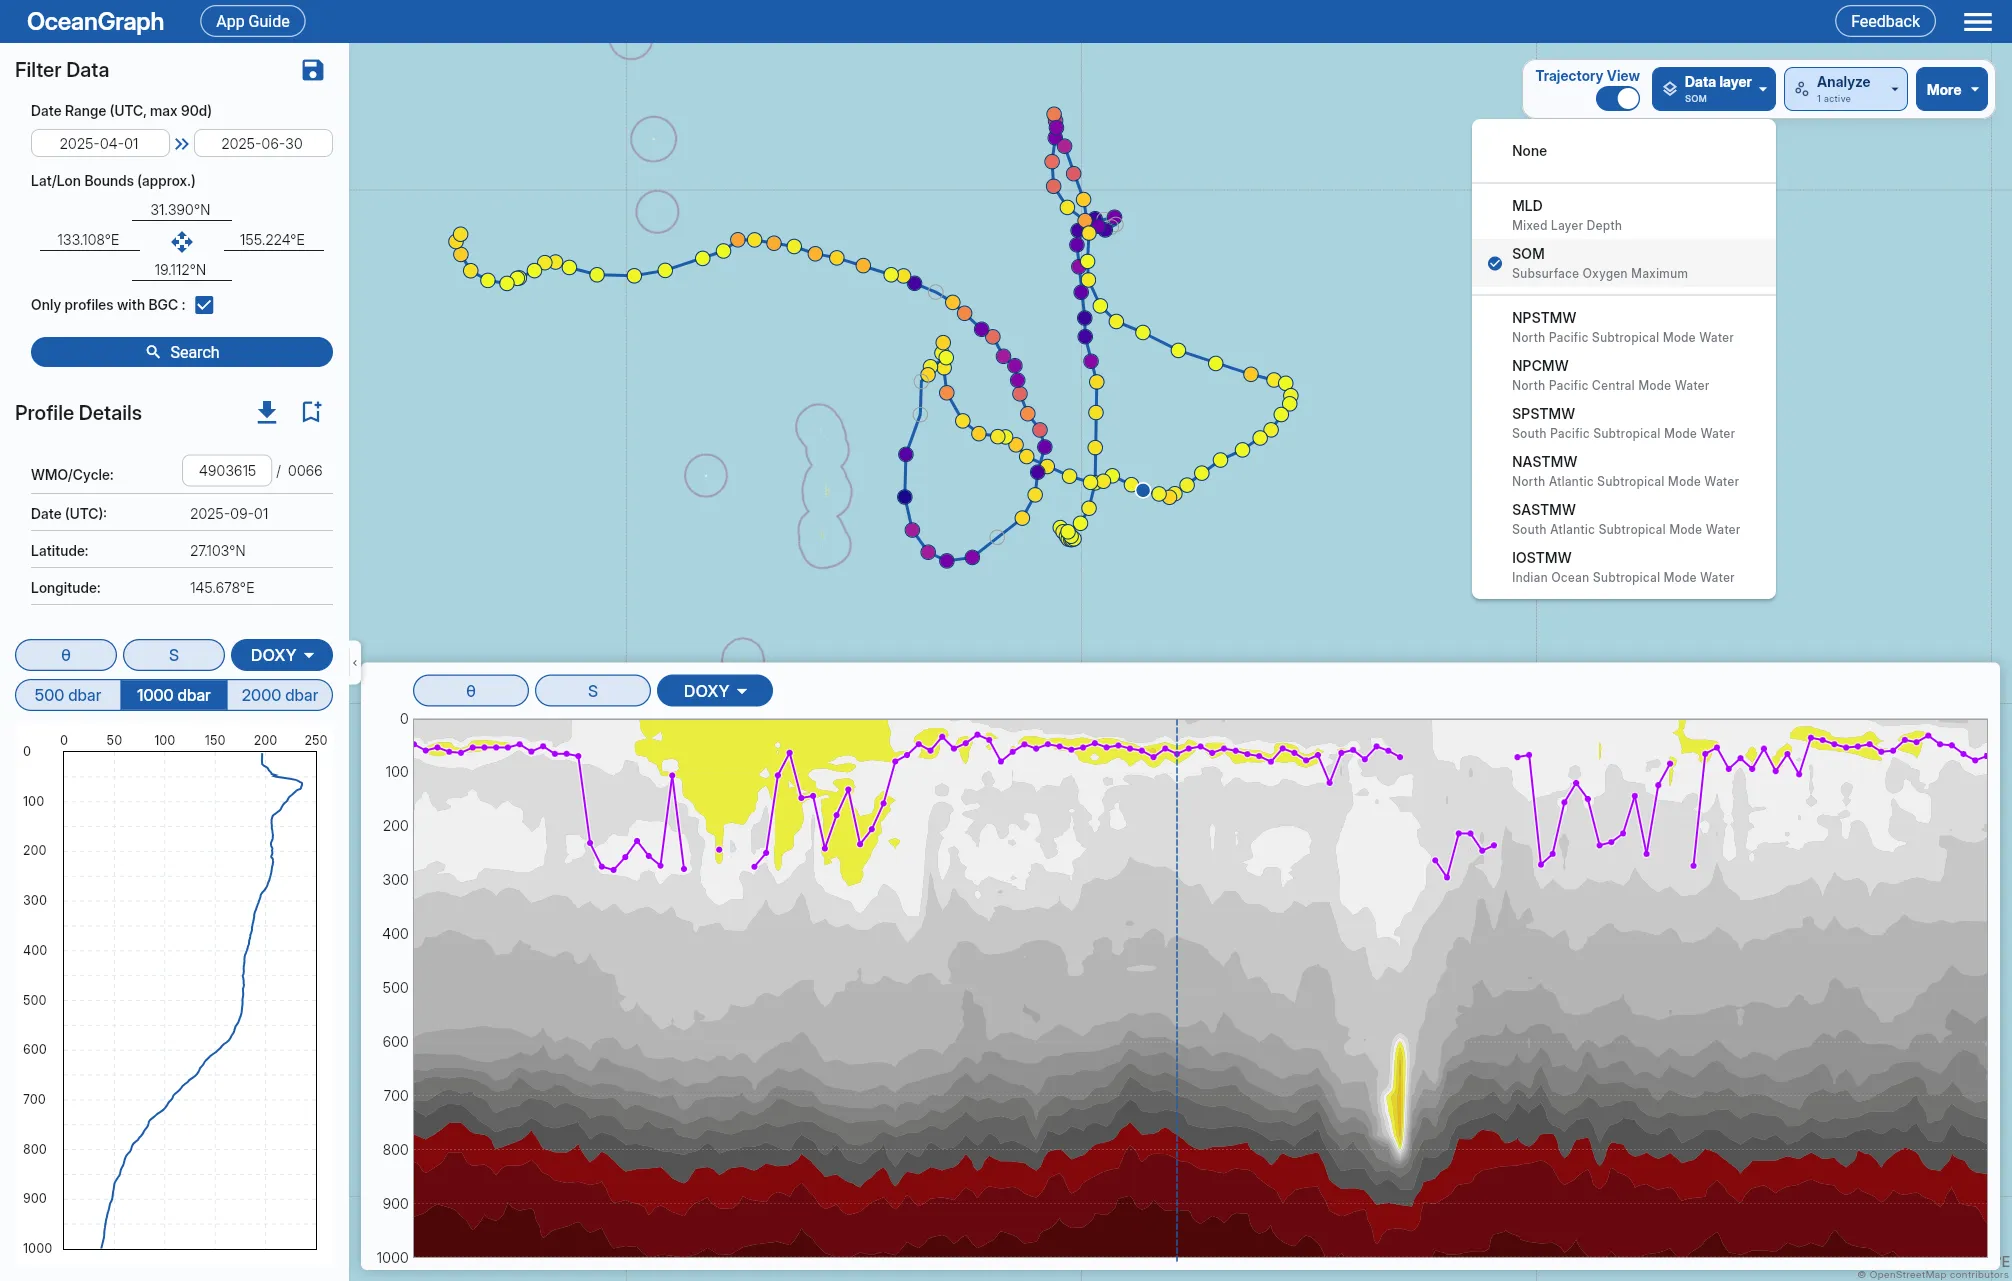
OceanGraph exposes pH as pH (total scale, in situ) in its profile and time-series vertical-section charts.
- Search by region, date, or WMO ID, optionally using Only profiles with BGC. This filter requires at least one supported BGC variable, so confirm that pH itself is available.
- Open the profile charts, then compare pH with the physical profiles and oxygen. Check the profile’s date, position, WMO ID, and cycle number, and examine the pressure range over which a feature appears.
- Inspect neighboring cycles along the trajectory. If a section is available, use it to locate repeated structure and then return to the individual profiles.
- Before calculating small differences or trends, return to the Argo source data and review the pH scale, processing status, QC, and uncertainty.
The number of digits shown for pH does not indicate measurement accuracy. The Data Filtering Policy and data limitations explain how data are processed and displayed.
The Search and Bookmark guide covers profile selection, and the Trajectory and Time-Series Vertical Section guide covers repeated profiles. To choose other variables to examine alongside pH, continue with What Does BGC Argo Measure?.
Further Reading
- NOAA: What Is Ocean Acidification?
- BGC Argo: pH measurements
- JMA: Ocean acidification and observed vertical and temporal changes
- Sutton et al. (2022): Advancing best practices for assessing trends of ocean acidification time series
- Bittig et al. (2019): A BGC-Argo Guide: Planning, Deployment, Data Handling and Usage