On this page
El Niño is identified through sustained changes in the tropical Pacific ocean-atmosphere system, but its ocean signal is not confined to the surface. Below the equatorial Pacific, the depth of warm water changes, the thermocline becomes less steep from west to east, and cold subsurface water has less influence on the eastern surface.
The Normal Equatorial Pacific Is Tilted Below the Surface
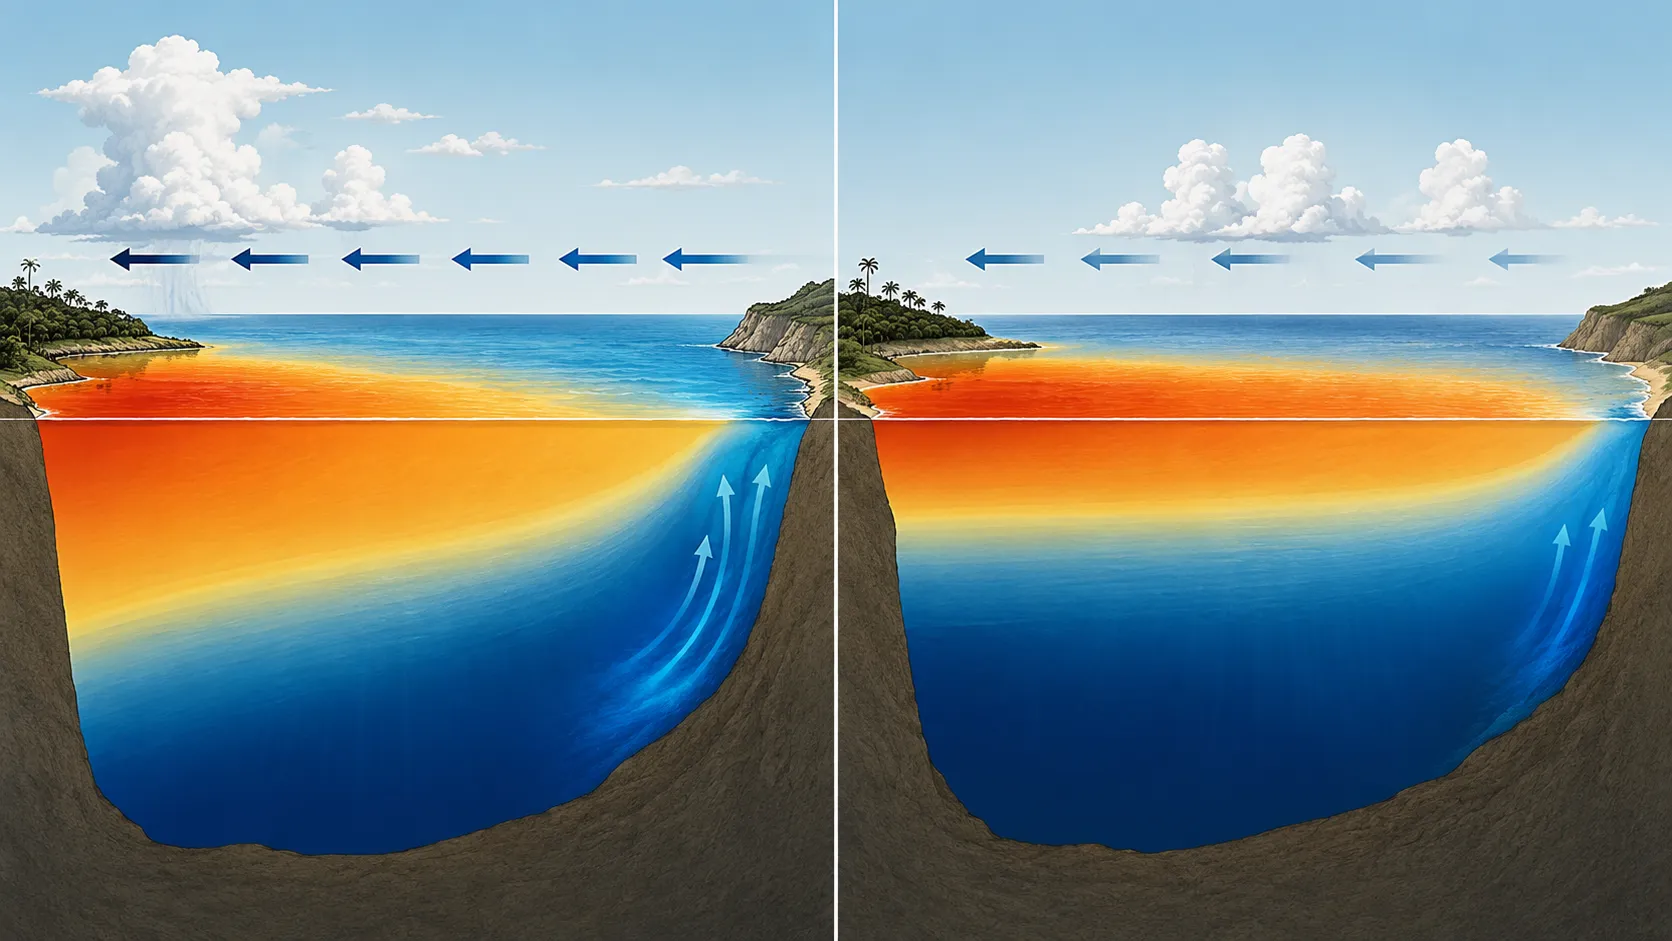
Under neutral conditions, easterly trade winds push warm surface water toward the western equatorial Pacific. The warm pool near Indonesia and the western Pacific is not just warm at the surface; warm water also extends deeper there.
In the eastern Pacific, especially near South America, colder water lies much closer to the surface. Upwelling can bring that cooler, nutrient-rich water upward. The boundary between the warm upper layer and colder water below—the thermocline—is therefore:
- Deeper in the western equatorial Pacific
- Shallower in the eastern equatorial Pacific
- Sloped upward from west to east
The Japan Meteorological Agency describes this normal arrangement and its atmospheric connection in What are El Niño and La Niña?. NOAA’s Pacific Marine Environmental Laboratory also illustrates the west-to-east thermocline slope in its El Niño schematic diagrams.
What Changes During El Niño
During El Niño, the equatorial trade winds weaken relative to normal conditions. Warm water that had been concentrated toward the west spreads farther into the central and eastern Pacific.
The vertical structure changes in different ways across the basin:
- The thermocline generally deepens in the central and eastern equatorial Pacific
- It becomes shallower in parts of the western Pacific
- The west-to-east thermocline slope weakens
- Eastern upwelling draws from warmer water because cold water is farther below the surface
The result is a positive feedback. A deeper eastern thermocline makes it harder for upwelling to cool the surface; a warmer surface then changes tropical rainfall and winds, which can reinforce the ocean pattern for a time.
NOAA’s El Niño sea-level and temperature cross sections show warm water spreading eastward as the thermocline flattens. JMA’s guide to subsurface temperature sections in El Niño monitoring explains why the thermocline and upper-ocean heat content are monitored alongside sea-surface temperature.
The schematic below places neutral conditions on the left and El Niño on the right.
A Profile Shows Warm-Water Depth
A temperature profile shows how far downward the warm upper layer extends at a given place and time.
In the eastern or central equatorial Pacific, an El Niño-period profile may show:
- Warm water extending deeper than in a suitable neutral comparison
- The strongest temperature gradient occurring farther below the surface
- A reduced temperature contrast across the shallow upper ocean
In the western Pacific, warm-water and thermocline shifts differ from those in the east, so compare profiles within the same region.
Salinity provides additional density context. Temperature profiles, sea-surface temperature anomalies, winds, sea level, and the coupled atmospheric response all contribute to the full picture.
Sea-Surface Temperature and Subsurface Heat Answer Different Questions
Sea-surface temperature describes the upper boundary of the ocean. A temperature profile shows the thickness and shape of the warm layer below it. Upper-ocean heat content integrates temperature over a depth range.
Those views are connected but not interchangeable:
| View | What it helps answer |
|---|---|
| Sea-surface temperature anomaly | Is the surface warmer or cooler than the climatological baseline? |
| Temperature profile | How deep is the warm layer at one place and time? |
| Equatorial vertical section | How does thermocline depth vary from west to east? |
| Upper-ocean heat content | How much warm water is stored across a specified layer and region? |
Why Sea Surface Temperature Is Not Enough to Measure Ocean Warming explains the broader difference between a surface value, a profile, and heat stored through depth.
Connect Individual Profiles to ENSO Monitoring
Official ENSO monitoring compares observations with a climatological baseline across defined regions and months. It also considers the atmosphere, because El Niño is a coupled ocean-atmosphere phenomenon.
The warm-layer depth in an individual profile also reflects factors other than ENSO:
- The normal west-to-east structure of the tropical Pacific
- Seasonal variation
- An ocean eddy or wave
- A slightly different sampling location
- Short-lived weather forcing
When comparing profiles from one drifting float, account for changes in both time and position.
Explore the Subsurface Pattern in OceanGraph
OceanGraph helps you inspect how actual Argo profiles differ across the tropical Pacific.
A focused comparison is:
- Choose a documented El Niño period from an official source.
- Search a short date range in a small western, central, or eastern equatorial Pacific box.
- Read several temperature profiles rather than selecting only the most dramatic one.
- Compare them with profiles from the same region and season during a neutral period.
- Check dates, positions, and salinity before attributing a difference to ENSO.
The Search and Bookmark guide describes OceanGraph’s geographic and date filters. If you follow one float through multiple cycles, the Trajectory and Time-Series Vertical Section helps keep its movement visible.
Time-Series Vertical Sections in Oceanography Explained covers the difference between a drifting-float sequence and a fixed-location time series.