On this page
Upwelling is the upward movement of seawater toward the surface. Where wind-driven transport carries upper-ocean water away from a coast or spreads it apart near the equator, water rises from below to replace it. That water is often colder and richer in nutrients, connecting ocean circulation with the growth of phytoplankton.
The connection is easiest to understand in two stages: what moves the water, and what the rising water carries. Cold water does not rise because it is cold; wind and the resulting circulation can move it upward despite its greater density. NOAA’s introduction to upwelling outlines this replacement of upper water by water from below.
Coastal Upwelling Starts With Transport Away From the Shore
Wind transfers momentum to the ocean, while Earth’s rotation changes the direction of the wind-driven flow. In the classical steady Ekman model, transport summed through the wind-driven layer is directed 90° to the right of the wind in the Northern Hemisphere and 90° to the left in the Southern Hemisphere. This is Ekman transport, not the direction of every current at every depth. NOAA/PMEL’s explanation of Ekman theory also discusses how fronts modify that idealized response.
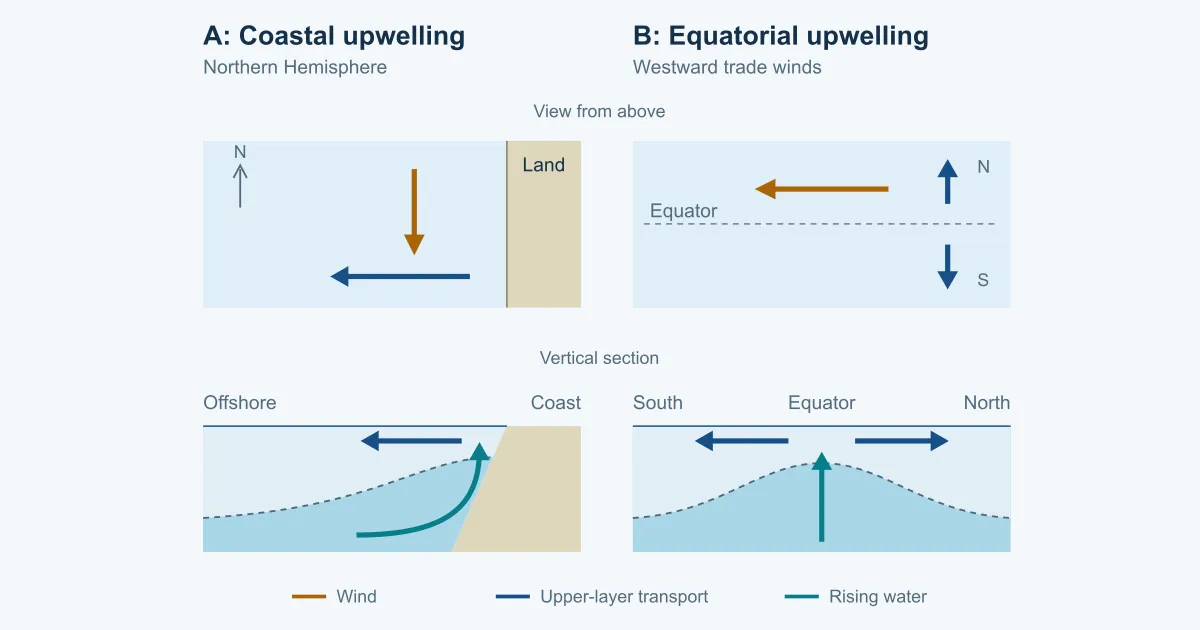
Consider a roughly north–south coast with land to the east, as along much of western North America. A wind blowing southward can drive net upper-layer transport westward, away from the coast. Water rises along the coastal slope to replace it. Along a similarly oriented coast in the Southern Hemisphere, a northward wind can drive the offshore transport instead.
If wind drives water toward the shore, accumulation and downward motion can occur: downwelling. The important combination is wind direction, hemisphere, and coastline orientation—not simply whether the wind is strong. NOAA’s coastal upwelling tutorial describes the contrast.
Equatorial Upwelling Does Not Need a Coast
Across much of the equatorial Pacific, the trade winds have a westward component. Wind-driven transport on the northern side is directed northward, and on the southern side southward. Water spreads away from the equator on both sides, with an upward supply from below.
The Coriolis parameter becomes zero at the equator, so the usual constant-latitude Ekman formula cannot be applied at exactly 0°. The useful picture is the divergence of transport on either side. Cronin and Sprintall’s review of wind forcing in the upper ocean connects this divergence to equatorial upwelling and cooler surface water.
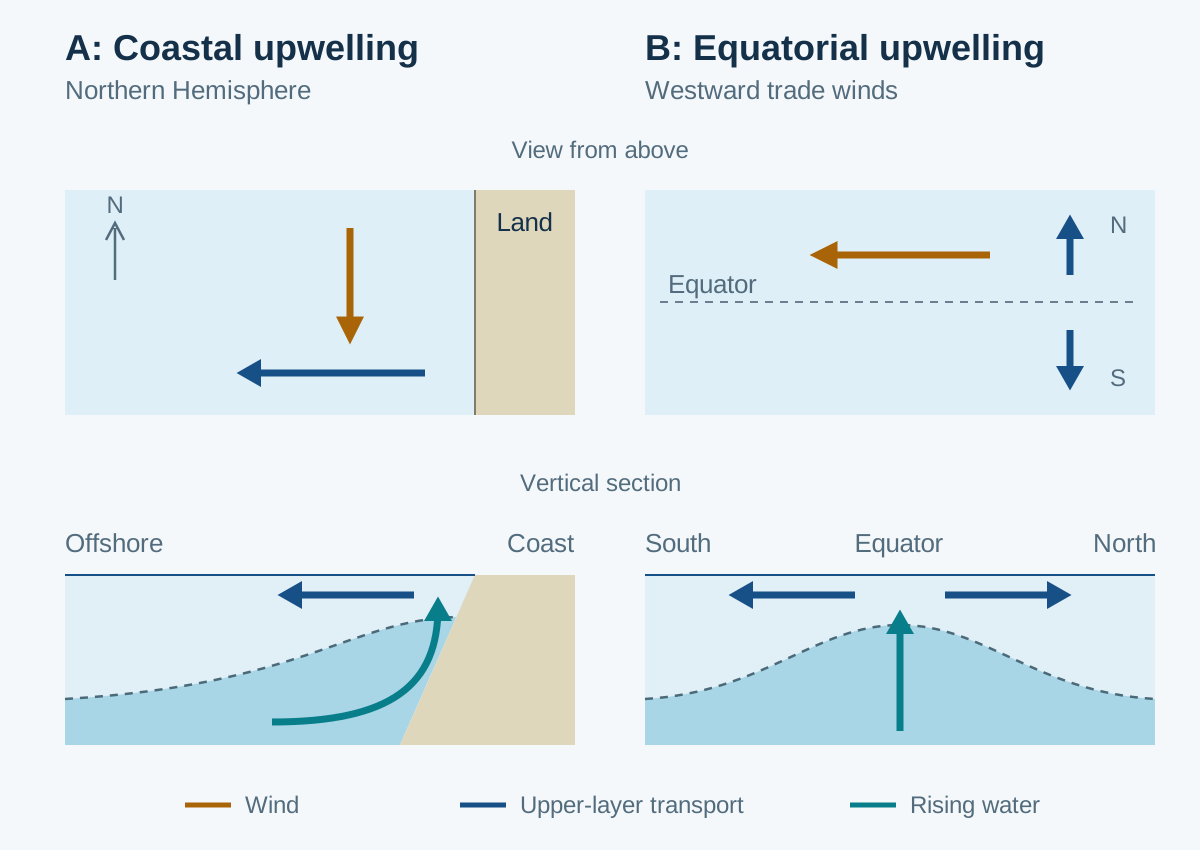
In the diagrams, brown arrows show wind, dark blue arrows show net upper-layer transport, and green arrows show rising water. Panel A is a Northern Hemisphere coast, viewed from above and then across the shore. Panel B shows the equator from above and then a south-to-north section. The dashed line in the plan view of panel B marks the equator; dashed lines in the vertical sections mark the thermocline, which can lie closer to the surface in the upwelling region.
Changing winds and the depth of the water supplying the upwelling both matter. During El Niño, a deeper thermocline in the eastern equatorial Pacific can make the water reaching the surface warmer. El Niño Below the Surface explains that basin-scale change.
Why Rising Water Often Supplies Nutrients
Phytoplankton take up nutrients in the sunlit ocean. Some of the organic matter they produce sinks, and its decomposition returns nutrients to the water below. This helps establish a nutrient-poor upper layer above water containing more nitrate and other nutrients. Upwelling can carry this subsurface supply into depths where photosynthesis is possible. The BGC Argo nitrate overview explains why measuring nitrate helps connect physical supply with biological use.
The source need not be the abyssal ocean. Coastal and equatorial upwelling can supply water from within the upper ocean, and source depth varies with circulation and stratification. For these nutrients to support photosynthesis, they must reach the illuminated layer, either in upwelled water or through mixing from below. A shallower nutrient-rich layer alone does not establish that this supply has occurred.
More nitrate does not guarantee a larger phytoplankton bloom. Light, iron and other nutrients, grazing, and the time since the supply arrived also matter. NASA’s introduction to phytoplankton describes these controls on growth and abundance. Productive upwelling regions can support food webs and fisheries.
Look for Structure, Then Test the Explanation
Several profile features can be consistent with an increased influence of subsurface water:
| Profile feature | What to compare |
|---|---|
| A shallower thermocline | Does the main temperature transition move upward across nearby profiles? |
| A shallower nitracline | Does nitrate start increasing closer to the surface? |
| Nitrate in the upper layer | Is it present where light is available, and is there a corresponding chlorophyll change? |
The nitracline, where nitrate changes rapidly with depth, need not coincide with the thermocline. Biological uptake can remove nitrate after water rises; the water’s temperature and salinity may retain a physical contrast even when its nitrate has changed.
A cold surface can also result from heat loss to the atmosphere, horizontal transport, or mixing with colder water below. A shoaling thermocline can reflect a passing wave or a different location along a front. Upwelling involves upward transport; turbulent mixing involves exchanges that blend properties across layers. Both can supply nutrients and can occur together.
Profiles describe properties at sampled places and times. Establishing upward velocity or a local cause requires additional information such as winds, current measurements, repeated sampling, or a circulation analysis. For the basic layers, begin with How Does the Ocean Change With Depth?; for nutrient interpretation, see Nitrate Profiles in the Ocean.
Compare Offshore Profiles in OceanGraph
An offshore equatorial comparison is a useful starting point for Argo. For example, search a 30-day period within 2°S–2°N and 120°W–110°W in the eastern equatorial Pacific, then choose a smaller area around available profiles.
- Compare several profiles from nearby locations and similar dates, looking at the warm upper layer and the pressure range of the thermocline. Read θ as potential temperature, and inspect salinity alongside it.
- Select Only profiles with BGC if you want nutrient measurements, then check whether the individual profiles actually contain nitrate. The filter includes profiles with any supported BGC variable.
- Where nitrate is available, compare its upper-layer concentration and transition with temperature, salinity, and chlorophyll. A missing value or blank area is not a measured zero.
- For a selected float, turn on Trajectory, open Analyze, and choose View section. Compare adjacent cycles while checking the map: both location and time change as the float drifts.
- To investigate a possible wind-related change, compare the profile dates with an independent wind record for that region.
The international Argo program’s sampling description explains its broad spatial coverage and typical ten-day cycle. Such sampling can miss narrow coastal bands and short wind events. Ship sections, coastal moorings, and other observations can resolve those questions more directly.
The Search and Bookmark guide explains geographic and BGC filtering. The Trajectory and Time-Series Vertical Section guide covers the section controls and gaps. To connect the patterns you find with wider circulation, continue with What Causes Ocean Currents?.