On this page
Mixed layer depth is not measured. It is defined, and then computed — which means the number depends on decisions you make before any arithmetic happens. Which variable do you test? What depth do you measure the change from? How large a change counts as leaving the mixed layer? And what do you do between measurement levels?
Two defensible criteria can produce MLD values about 100 dbar apart on the same Argo profile. Comparisons therefore need matching calculation settings.
If you want the physical meaning of the mixed layer and how its depth varies through the year, Mixed Layer Depth (MLD) Explained covers that first. This guide assumes you already have a profile in front of you.
Threshold Methods, Gradient Methods, and Fitting Algorithms
Three families of method are in common use.
A threshold method finds the shallowest depth at which a property differs from its value at a reference depth by more than a set amount. It is the most widely used family because it behaves predictably on profiles with coarse or uneven vertical sampling, and because it needs no tuning per profile.
A gradient method finds the shallowest depth at which the vertical gradient of a property exceeds a limit — for example 0.025 °C per metre. Gradients are more sensitive to vertical resolution and to sensor noise, so the same criterion applied to a 2 dbar profile and a 25 dbar profile can behave quite differently.
An algorithmic method fits the shape of the profile rather than testing a single number. Holte and Talley’s hybrid algorithm fits lines to the mixed layer and the seasonal thermocline, assembles a set of candidate depths from threshold, gradient, and curvature evidence, and then selects among them. It tends to report shallower mixed layers than threshold methods, and it is the basis of the Argo mixed layer database maintained at Scripps.
The rest of this guide is about threshold methods, because that is what most people implement and what most published MLD values come from.
Decision 1: Which Variable to Test
Potential temperature
Temperature is available on essentially every profile, including the historical XBT and CTD records that predate Argo, which is why long climatologies are often temperature-based. Using in-situ temperature directly is a mistake below a few hundred decibars, because compression warms the water without changing its properties; convert to potential temperature (θ) or Conservative Temperature first.
The weakness of a temperature criterion is that it cannot see salinity stratification. In the tropics, and anywhere with strong rainfall or river input, a sharp halocline can sit above the thermocline. The layer between them is stratified in density but nearly uniform in temperature, so a temperature criterion reports a mixed layer that reaches into water that is not mixing. Sprintall and Tomczak named that gap the barrier layer.
Potential density
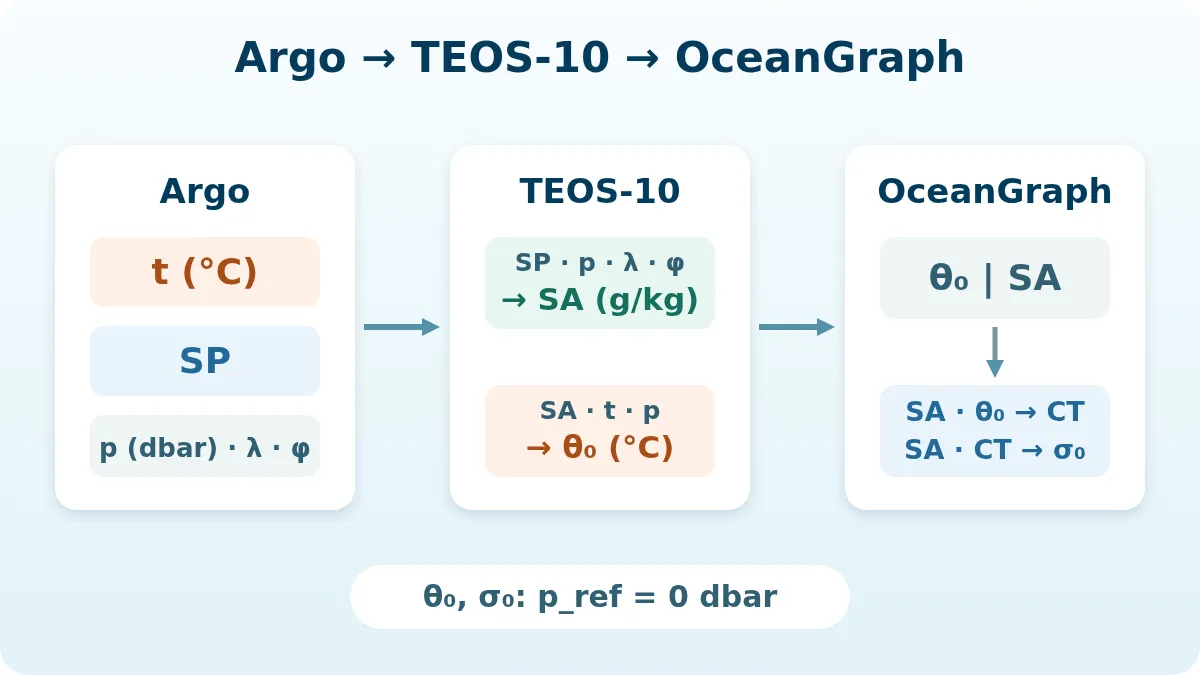
Density is what actually sets static stability, so a density criterion is closer to the physical question. Use potential density anomaly referenced to 0 dbar (σ0) rather than in-situ density, so the profile is compared at a common pressure. Deriving it needs salinity as well as temperature, and — if you are working in TEOS-10 — Absolute Salinity and Conservative Temperature, which in turn need position.
Salinity
A salinity threshold is rarely used on its own, because the salinity contrast across the base of the mixed layer is small in much of the open ocean. It earns its place as a third test alongside temperature and density: when a salinity criterion returns a much shallower depth than a temperature criterion, that is a signal to look at the profile rather than to trust either number.
Decision 2: Where to Reference the Change
Every threshold is a change from something. The obvious choice — the shallowest measurement in the profile — is the wrong one. The shallowest sampled pressure varies among profiles, and the top few metres carry a diurnal warm layer that appears and disappears within a day. Referencing to the shallowest point makes MLD depend on when the float surfaced and the depth of that shallowest measurement.
A shallow reference depth below that noise is the standard fix. 10 m (or 10 dbar) is the most common choice; de Boyer Montégut and colleagues adopted it in their global MLD climatology, and much later work follows them. A 5 m reference is also used, and gives slightly shallower mixed layers because it sits above more of the near-surface stratification.
Decision 3: How Large a Threshold
Larger thresholds give deeper mixed layers. That is the whole of it, and it is why criteria are not interchangeable.
| Source | Variable | Reference | Threshold |
|---|---|---|---|
| de Boyer Montégut et al. (2004) | potential temperature | 10 m | 0.2 °C |
| de Boyer Montégut et al. (2004) | potential density | 10 m | 0.03 kg/m³ |
| Wyrtki (1964); Obata et al. (1996) | temperature | near-surface | 0.5 °C |
| Kara et al. (2000) | density equivalent of a temperature change | 10 m | 0.8 °C equivalent |
| Levitus (1982) | potential density | surface | 0.125 kg/m³ |
The Kara criterion is worth understanding even if you do not use it. Instead of a fixed density threshold, it converts a fixed temperature change into the density change that temperature change would produce at the local temperature and salinity, so the density threshold varies with the water. This avoids a fixed density threshold being effectively strict in warm water and lax in cold water, where the same temperature change moves density by very different amounts.
The figure below applies four of these thresholds to one late-winter Argo profile from the western North Pacific.
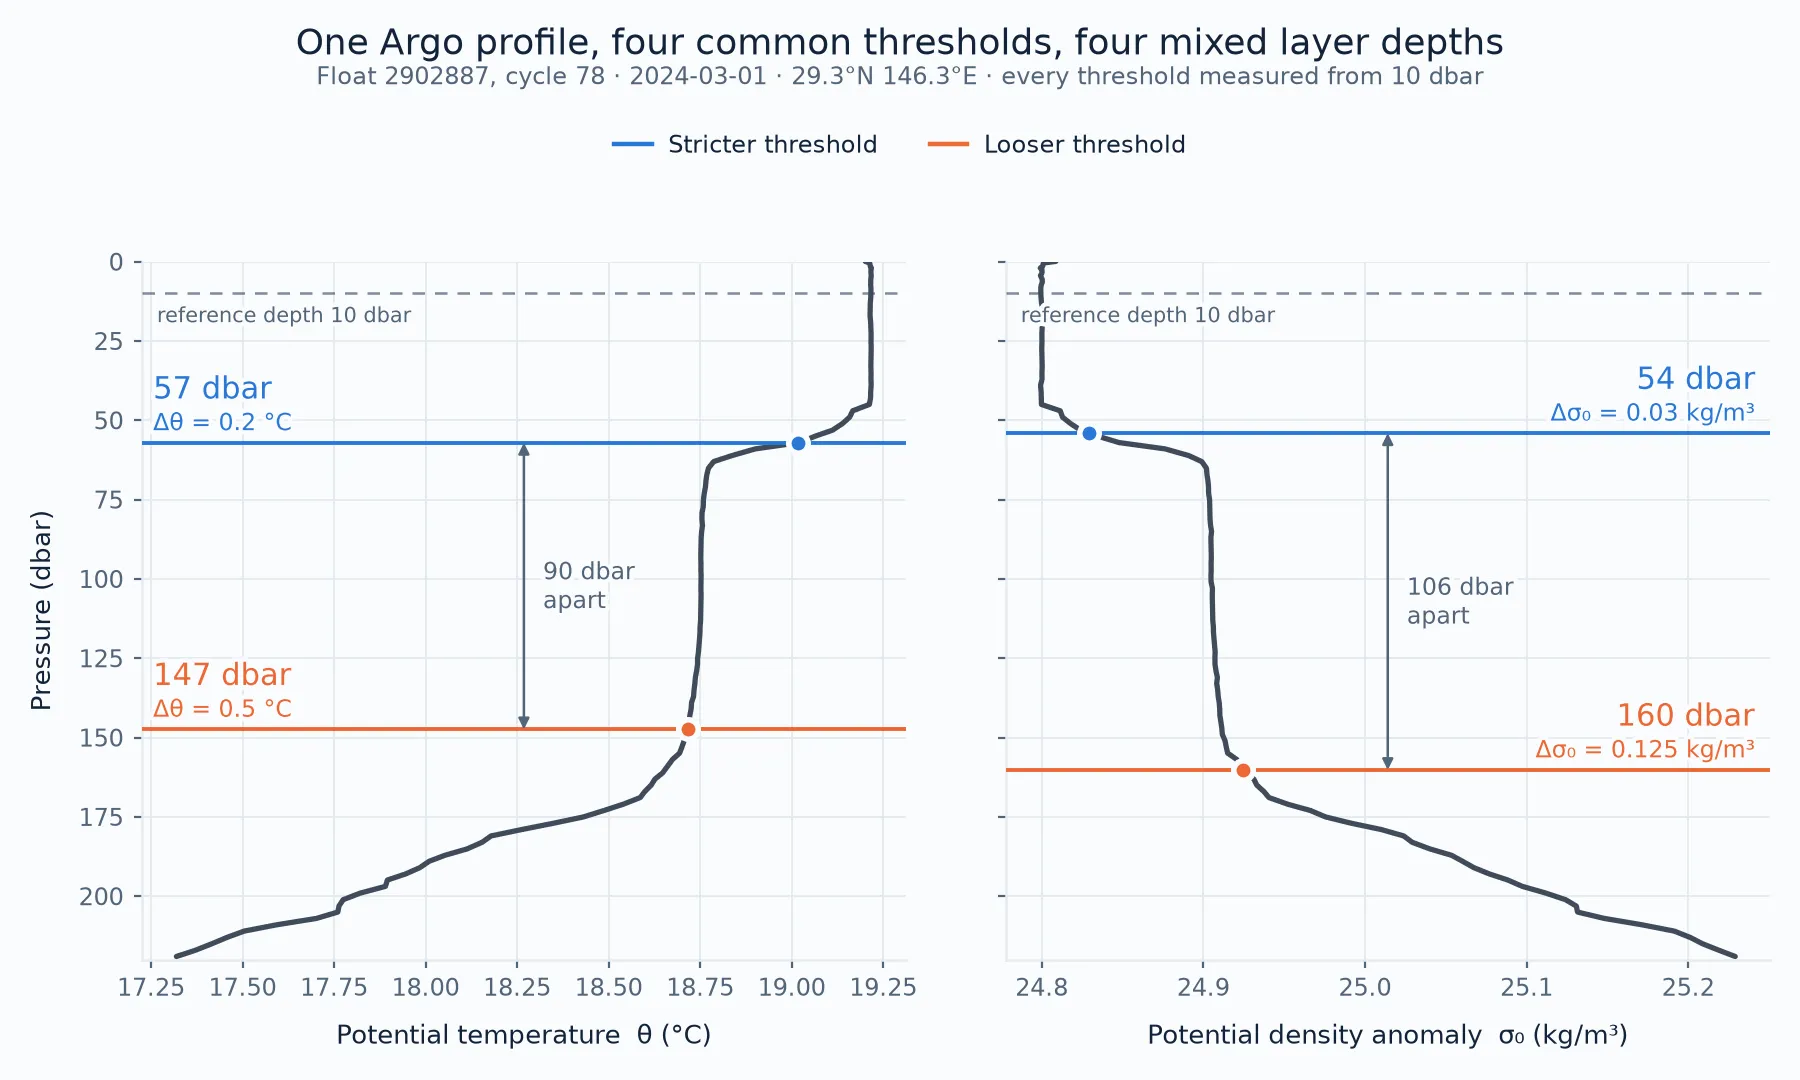
The two tight thresholds agree closely with each other (57 and 54 dbar) and the two loose thresholds agree closely with each other (147 and 160 dbar), but the two groups are about 100 dbar apart. The disagreement is not between temperature and density. It is between “the first sign of stratification” and “unambiguously out of the mixed layer” — two different questions that both get called mixed layer depth.
Which one you want depends on what the number is for. A tight threshold tracks restratification in spring, when a thin new layer forms above a deep remnant layer. A loose threshold is more robust to sensor noise and to a small amount of near-surface structure, which matters when you are averaging thousands of profiles.
Decision 4: What Happens Between Levels
An Argo profile is a set of discrete levels, and the threshold is almost never crossed exactly at one of them. Two treatments are common:
- Take the first level at which the deviation exceeds the threshold.
- Find the two levels that bracket the threshold and interpolate the pressure where the crossing occurs.
The first is easier to write and quantises MLD to the sampling grid. Argo bin spacing typically widens with depth, so this bias is not uniform: it is small near the surface and can be tens of decibars deep in the water column. The second removes that bias for a few extra lines of code, and is what the figure above uses.
If you interpolate, interpolate on pressure, not on array index. Using array position as the horizontal coordinate silently assumes evenly spaced levels, which Argo profiles are not.
Coverage Checks Before the Number Means Anything
A threshold method returns a number for almost any input. Two checks decide whether that number deserves to exist.
Does the profile actually sample the reference depth? If the shallowest measurement is much deeper than the reference depth, there is nothing to reference against, and substituting the shallowest available value quietly changes the criterion. A common rule is to require the shallowest observation to be within a fixed distance of the reference depth and to skip the calculation otherwise.
Is there enough shallow data to resolve a shallow mixed layer? A profile whose first few points are 50 dbar apart cannot distinguish a 20 dbar mixed layer from a 60 dbar one, whatever the interpolation says.
A Procedure You Can Implement
The order below is one workable arrangement, and steps 4 to 7 take whatever variable, reference depth, threshold, and interpolation you settled on in the four decisions above.
- Select raw or adjusted values using the profile’s data mode, and apply the matching quality-control flags. Argo Data Quality Control covers how to make that choice.
- Sort by pressure and remove duplicate pressure levels.
- Convert to the quantities your criterion needs — potential temperature, Absolute Salinity, σ0 — using a TEOS-10 implementation such as the Gibbs SeaWater toolbox.
- Apply the coverage checks. Skip the profile if it fails.
- Interpolate the reference value at the reference depth.
- Walk down from the reference depth to the first level where the deviation reaches the threshold.
- Interpolate the crossing pressure between that level and the one above it.
Comparing MLD Values You Did Not Compute
When you take MLD values from a paper, a climatology, or a data product, the first question is not what the values are but how they were defined. Before comparing two sources, check that they agree on the variable, the reference depth, the threshold, and whether the result is a pressure in decibars or a depth in metres. If they differ, the comparison is measuring the criteria as much as the ocean.
The pressure-versus-depth point is easy to overlook because the numbers look similar. At 2,000 dbar the corresponding depth is roughly 1,980 m at the equator and about 1,972 m at 60° latitude — under one percent, but a systematic offset, and one that varies with latitude. In the upper few hundred decibars where mixed layers live, the difference is small enough to ignore for exploration and large enough to declare when you publish a number.
One Worked Implementation: How OceanGraph Defines MLD
OceanGraph computes MLD from individual Argo profiles using the following settings.
- Variable: three criteria evaluated independently — potential temperature (θ), Absolute Salinity (SA), and σ0, all derived through the Gibbs SeaWater toolbox and TEOS-10.
- Reference depth: 10 dbar.
- Thresholds: Δθ of 0.5 °C, ΔSA of 0.05 g/kg, and Δσ0 of 0.125 kg/m³. The shallowest of the three crossings is adopted.
- Between levels: linear interpolation of the crossing pressure, recorded in decibars.
- Coverage: only rows with finite potential temperature (θ) and Absolute Salinity (SA) count. Within 0–2,000 dbar, at least three paired rows are required, including at least two at 50 dbar or shallower. The shallowest paired pressure must be no greater than 30 dbar and the deepest at least 10 dbar; when the first pair lies between 10 and 30 dbar, it supplies the reference values. Profiles that fail these checks, or that cross no threshold, are left without an MLD value.
Taking the shallowest of three independent criteria is a deliberately conservative choice for an exploration indicator: the reported value may end up set by temperature alone, salinity alone, or density alone, so it is not equivalent to a strictly density-based definition. The full specification, including how MLD feeds the subsurface oxygen maximum search, is in the App Guide’s Mixed Layer Depth (MLD) page.
Where a Visual Check Fits
Reading the profile is the fastest way to find out whether the criterion you chose is doing what you think. A profile with a sharp, unambiguous base will give nearly the same answer under any reasonable threshold; a profile with a gradual transition, a barrier layer, or a thin restratified surface layer will not, and that is worth knowing before you run the calculation over ten thousand profiles.
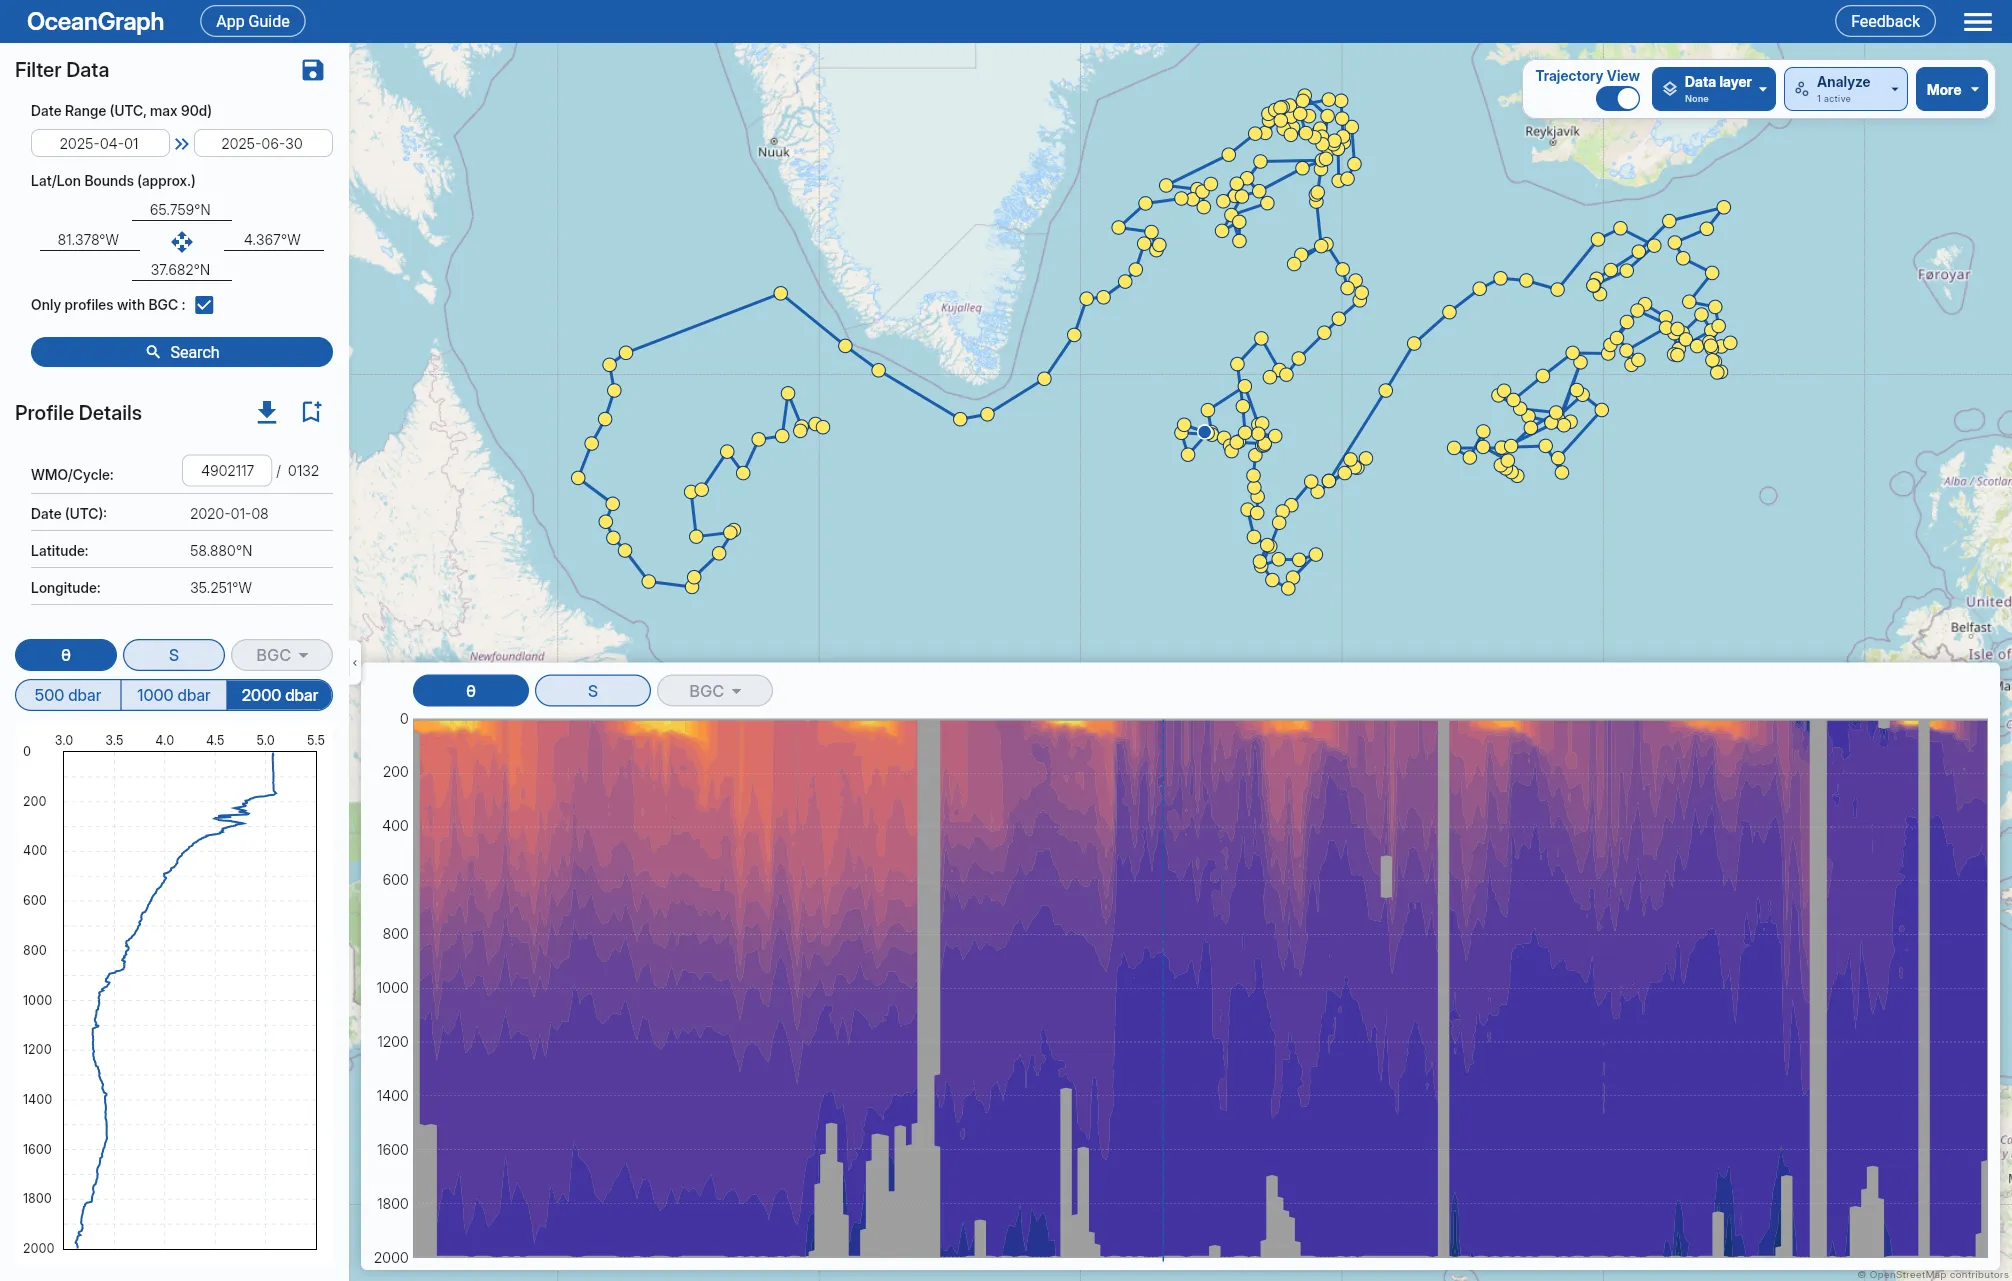
Comparing MLD-coloured search results across seasons and regions, then opening the underlying temperature and salinity profiles for the outliers, is a practical way to build that judgement. Ocean Temperature and Salinity Profiles Explained covers how to read the structure you will be looking at, and What Is Mode Water? explains why deep winter mixed layers matter beyond the number itself.
Frequently Asked Questions
What should I do with profiles where MLD is undefined?
Keep them as undefined and exclude them from statistics explicitly. Counting how many profiles fail is useful in itself: a region with many undefined values usually has a sampling problem, not a physical one.
Do I need to convert pressure to depth?
Not for a threshold calculation — thresholds work on any monotonic vertical coordinate, and Argo measures pressure. Convert only when the result must be reported in metres, and use a latitude-aware conversion when you do.