
On this page
NetCDF is excellent at storing multidimensional scientific data. A browser is excellent at displaying an interactive map. The difficult part of an ocean-data web app is everything between those two endpoints.
A reliable design must decide which observations are usable, preserve units and provenance, reshape files for the questions users actually ask, deliver only the required bytes, and keep the interface responsive. If those decisions are postponed until the front end, the browser becomes both slow and scientifically ambiguous.
Argo is the running example, but the same reasoning applies to glider, CTD, mooring, and model-output applications.
The Data Path, Not Just the Front End
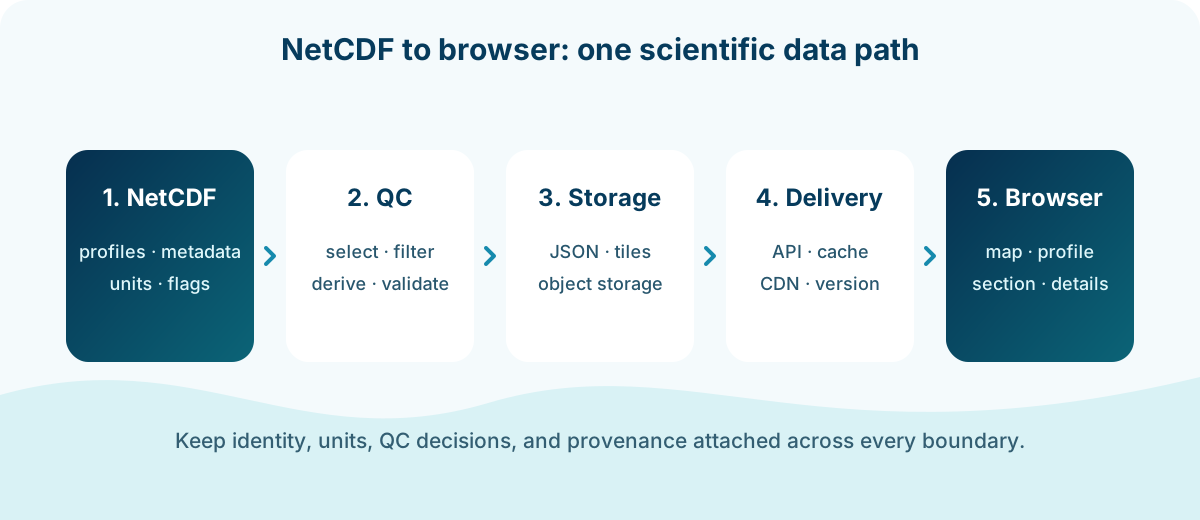
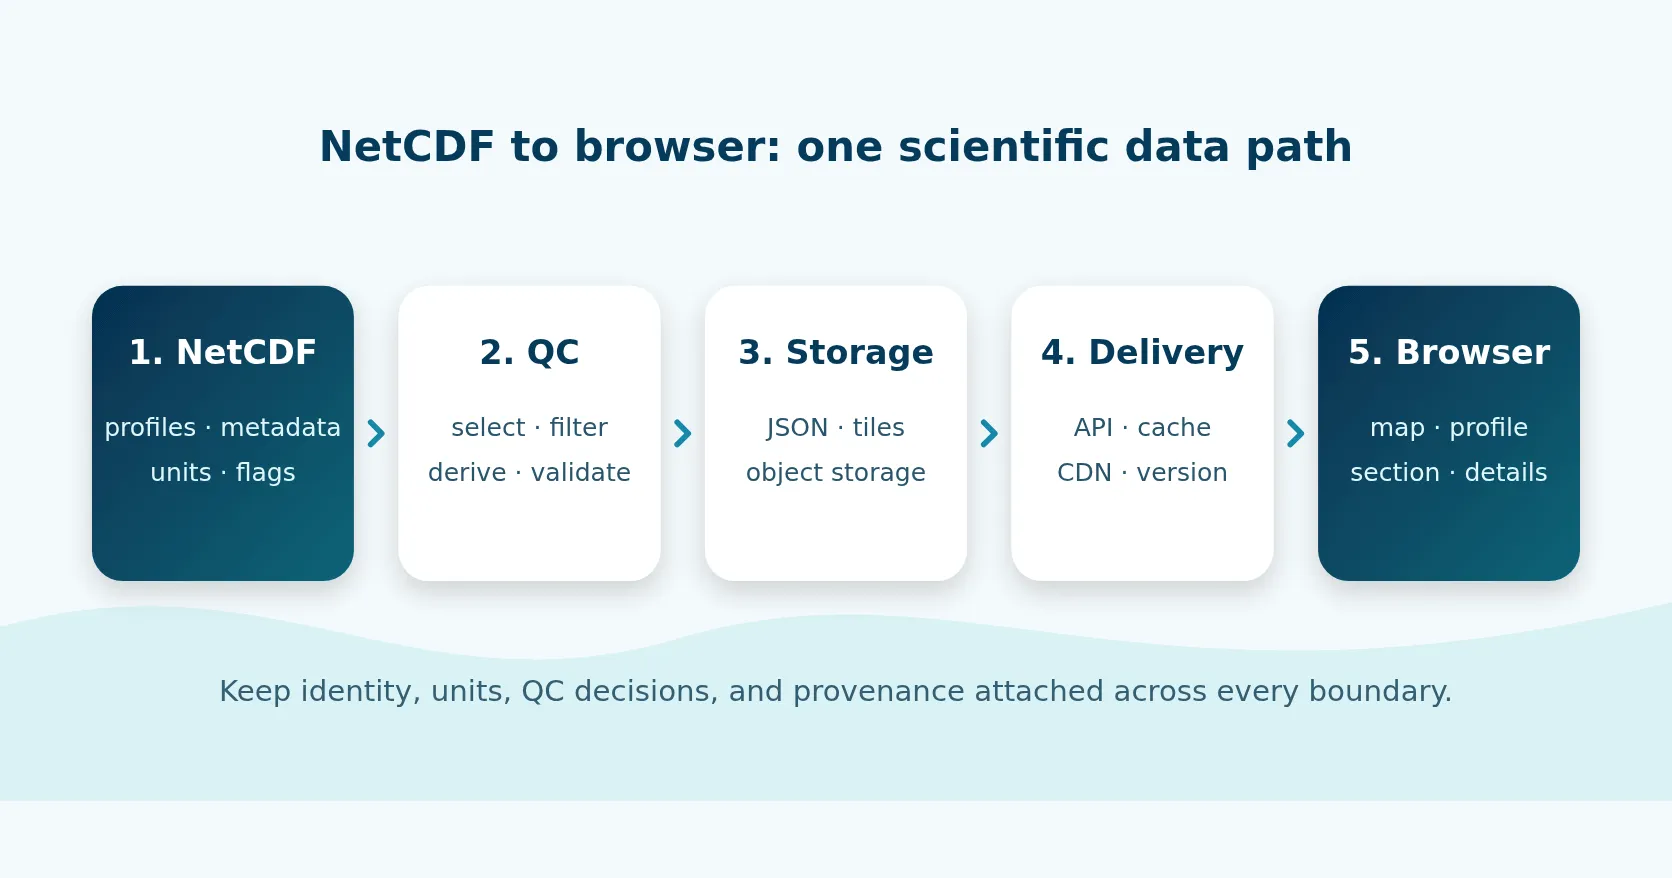
The five stages have different responsibilities:
- NetCDF source: measurements, dimensions, metadata, raw and adjusted variables, and quality fields.
- Scientific preprocessing: profile selection, QC, unit-aware calculations, interpolation where justified, and validation.
- Web-ready storage: compact JSON, columnar data, tiles, or reusable chart artifacts organized around access patterns.
- Delivery: an API for queries and metadata, object storage for larger immutable artifacts, and caching where responses are reusable.
- Browser: maps, vertical profiles, time-series sections, details, and controls that explain what is shown.
The arrows matter as much as the boxes. Each boundary needs a contract. A temperature array without its pressure coordinate is unusable; a plotted point without an observation ID cannot be traced; and an interpolated section without its missing-data rule can look more certain than the observations support.
Why Sending NetCDF Directly to the Browser Is Rarely Enough
Argo distributes profile files in NetCDF. A profile includes coordinates, measurements such as pressure, temperature, and salinity, quality flags, adjusted variables, and data-mode metadata. The official guide to Argo profile files explains how these fields work together.
A browser-facing application usually needs a different shape:
- A map needs lightweight positions and identifiers for many observations.
- A profile chart needs a few aligned arrays for one selected cycle.
- A vertical section needs many profiles placed on a common axis.
- A detail panel needs human-readable metadata, not every file attribute.
Downloading every source file to satisfy each interaction wastes bandwidth and repeats scientific interpretation in every client. It also makes it harder to update a rule consistently. A better default is to read the authoritative file once, create documented derivatives, and keep a source pointer with every result.
Start with User Questions and Access Patterns
Before choosing a database or JavaScript framework, identify the data needed for the interface’s everyday tasks.
| User interaction | Minimal response shape |
|---|---|
| Show observations in this region and period | IDs, positions, dates, data availability |
| Open one profile | Pressure/depth coordinate, selected variables, units, profile metadata |
| Compare cycles from one float | Cycle index, date, location, summary values |
| Draw a time-series vertical section | Common vertical grid, time/cycle axis, values, missing mask |
| Explain one plotted point | Source profile, parameter, selected value, QC/provenance summary |
These access patterns often suggest multiple derived artifacts instead of one universal response. A map index can remain small; profile payloads can load on selection; larger sections can be cached or stored as immutable objects.
This is also where scope discipline helps. OceanGraph, for example, is designed around early exploration of preprocessed Argo data. A focused product can optimize its data model for a few well-defined visual questions.
Put Scientific Decisions in a Reproducible Pipeline
The preprocessing stage centralizes scientific processing rules. For Argo, these include:
- whether an adjusted or raw field is selected;
- which QC values are accepted;
- whether related pressure, temperature, and salinity values remain aligned;
- how fill values become missing values;
- whether profiles with insufficient coverage are excluded;
- how a derived depth or thermodynamic variable is calculated;
- where interpolation is permitted and where a gap remains visible.
Those are not front-end formatting details. They determine what the application says about the ocean. Argo Data Quality Control Guide: QC Flags and Adjusted vs. Raw Data explains the field-level decisions, while Argo NetCDF Format Explained for Beginners introduces the source structure.
Pipeline outputs should be immutable or versioned as a set. Publishing an index from one run and profile files from another can create links to missing or inconsistent data. Each release should identify its source snapshot, code revision, configuration, generation time, and validation result.
Use Real Observations to Check the Derived View
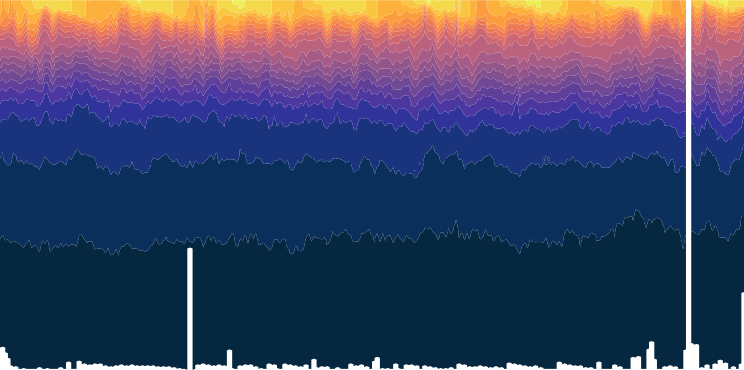
This temperature section was produced from an OceanGraph read-only Argo processing snapshot for WMO 5904935. White areas remain visible where the available profiles do not support a value.
For a web engineer, this figure is a validation target. The browser view should preserve the same cycle order, vertical direction, color domain, and gaps as the pipeline artifact. For a scientist, the profile ID and source version must remain available so a pattern can be checked against the underlying observation.
Argo data are openly available, but publications and products should follow the Argo acknowledgement and citation guidance, including the dataset DOI where appropriate.
Choose Storage by Role
Choose storage according to the role of each dataset.
Search metadata
A relational database or search index is useful for fields used in filtering: identifier, cycle, time, position, data availability, and publication version. Add indexes for actual query patterns, including geospatial indexes if the product supports region search.
Profile payloads
Compact JSON can work well for moderate profile arrays because it is easy for browsers to consume and cache. For much larger analytical transfers, columnar or chunked formats may be more appropriate. The choice should follow measured payload sizes and client behavior, not fashion.
Pre-rendered or dense artifacts
Object storage is a good fit for immutable SVG, PNG, JSON, or binary chunks addressed by stable paths. A CDN can cache them efficiently when the URL changes with the dataset version.
Decide What the API Should and Should Not Do
An API is valuable when the response depends on user parameters, authorization, or current metadata. It can validate region and time filters, impose response limits, and return a stable schema.
Do not make the API regenerate a vertical section from hundreds of source files on every request if the same section is repeatedly viewed. Generate reusable artifacts in the data pipeline and let the API return a versioned reference. Conversely, do not precompute every imaginable combination of variables, depth bounds, and color scales. Keep inexpensive presentation choices in the browser.
A practical division is:
- Pipeline: source parsing, QC, scientific derivation, expensive interpolation, aggregate artifact generation.
- API: query validation, indexed lookup, response assembly, version discovery.
- Browser: viewport filtering, selection, axis and unit labels, accessible interaction, and reversible visual styling.
Design for Incremental Loading
The first page should not require all profile arrays. A useful loading sequence is:
- Load the application shell and a bounded map/search index.
- Request profile data only after a user selects an observation.
- Load a dense section or comparison view only when that view opens.
- Cancel or ignore stale requests when the user changes selection.
- Cache immutable versioned responses.
Set explicit limits for bounding boxes, date ranges, and result counts. Return a clear message when a query is too broad rather than allowing the browser or API worker to run out of memory.
Compression matters, but reducing unnecessary fields usually matters first. Measure compressed response size, parse time, drawing time, and interaction latency separately; “the request was fast” does not mean the chart is cheap to render.
Make the Browser Explain the Data
A fast chart can still mislead. The interface should expose:
- variable name and unit;
- time and horizontal position;
- whether the vertical coordinate is pressure or depth;
- missing areas rather than a continuous painted surface;
- the profile, float, station, or deployment identity;
- a concise description of filtering and processing;
- a route to detailed provenance or source documentation.
The OceanGraph Data Source guide and Data Filtering Policy are examples of keeping user-facing interpretation rules outside the chart while still making them reachable.
For the contract behind these labels, continue to Preserving the Meaning of Ocean Data in Web Apps: Units, Missing Values, QC, and Provenance.
Test Across the Whole Path
Layer-specific tests are necessary but insufficient. Include a small known profile that can be followed from source to screen.
- Verify selected variables and QC rules against expected source values.
- Validate output schemas and reject non-finite JSON numbers.
- Confirm that API filters return only observations inside the declared bounds.
- Test missing values, empty profiles, and dateline-crossing regions.
- Compare a browser chart with a pipeline-generated reference image.
- Check keyboard access, legends, unit labels, loading states, and errors.
- Rebuild the same snapshot from a pinned environment.
How to Make a Research Analysis Reproducible with Docker explains why the software environment is part of the result, not merely a deployment convenience.
If designing and building this path inside your own team would be difficult, the inquiry link below can also be used to ask about design and implementation support.
Contact
Implementation support and annotation services
Ask about setup, design, and implementation support, or annotation services.
Frequently Asked Questions
Is an API always required?
No. A small, immutable dataset can be delivered as static versioned files. An API becomes useful for bounded search, metadata assembly, access control, or frequently changing query parameters.
